To book profits, here’s what traders can do with their Ethereum holdings

Just like Bitcoin, Ethereum too has had a pretty action-packed week. The market’s largest alt was trading just above $2,000 at press time. In fact, both its daily and weekly returns were finally in green too. While the former noted an uptick of 4.4%, the latter gained by 7.73% on the charts.
However, in the past, Ethereum’s market has seen instances where price breakouts like these have turned out to be false alarms. So, will Ethereum continue its rally this time or will its price end up declining further on the charts a few days later? Well, let’s see what the asset’s on-chain metrics have to say.
Are whales accumulating?
At this point, it most definitely looks like the big players are accumulating Ethereum. Whales that hold anywhere between 10k to 1 million ETH in their respective wallets now own a cumulative total of 60.52 million coins. In fact, this is the highest amount held by this tier in weeks.
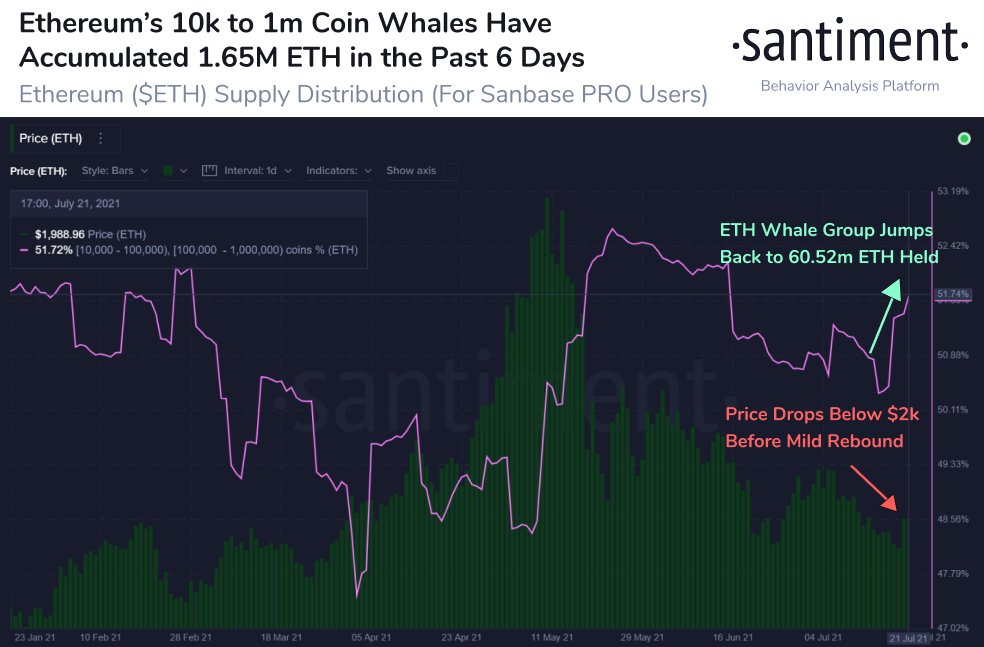
In fact, if the most recent dataset alone is taken into account, these market participants have accumulated a whopping 1.65 million coins in the past 6 days alone. At the end of the day, these big buys arguably paid off well and the same was reflected in the alt’s weekly RoI too. Nonetheless, the aforementioned trend needs to continue for ETH’s price to climb up the ladder.
What are the other market participants up to?
Unlike the whales, most other market participants have been disposing of their holdings of late. The same was evidenced by the supply on exchanges. A rise in this metric underlined that market participants are selling their ETH. Usually, a sign of strong HODLing sentiment arises when coins are moved from exchanges into private wallets and cold storage, but in Ethereum’s case, the opposite has been taking place since the 19th of July.
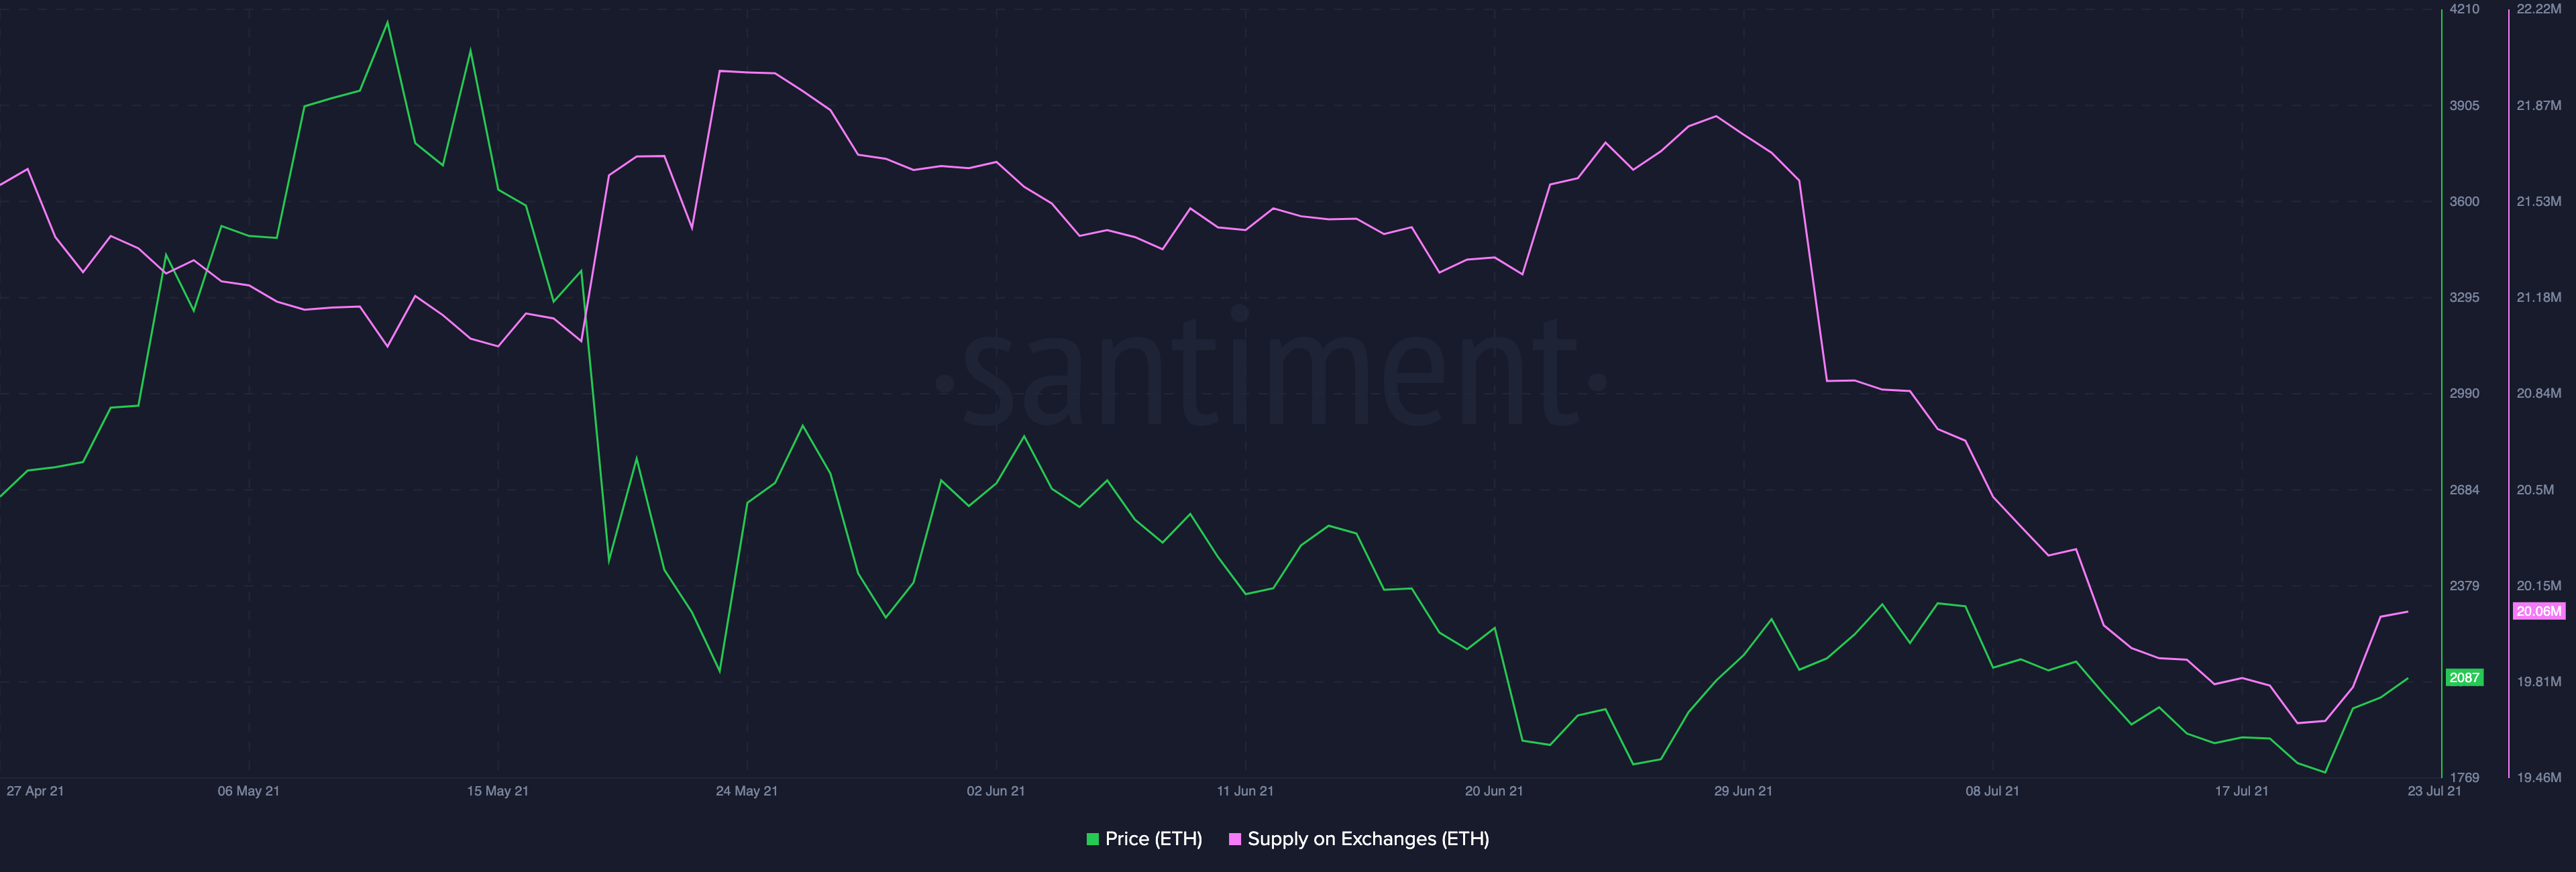
At this stage, it is evident that short-term gains are driving the market and ETH’s current valuation is an open invite to traders who wish to encash the same.
What about the price divergence?
Before looking at what this metric signals, it is important to note that the number of active addresses on the Ethereum network has been on the lower side for most of this month. In fact, the 480k level, at press time, was nowhere close to May’s 790k.
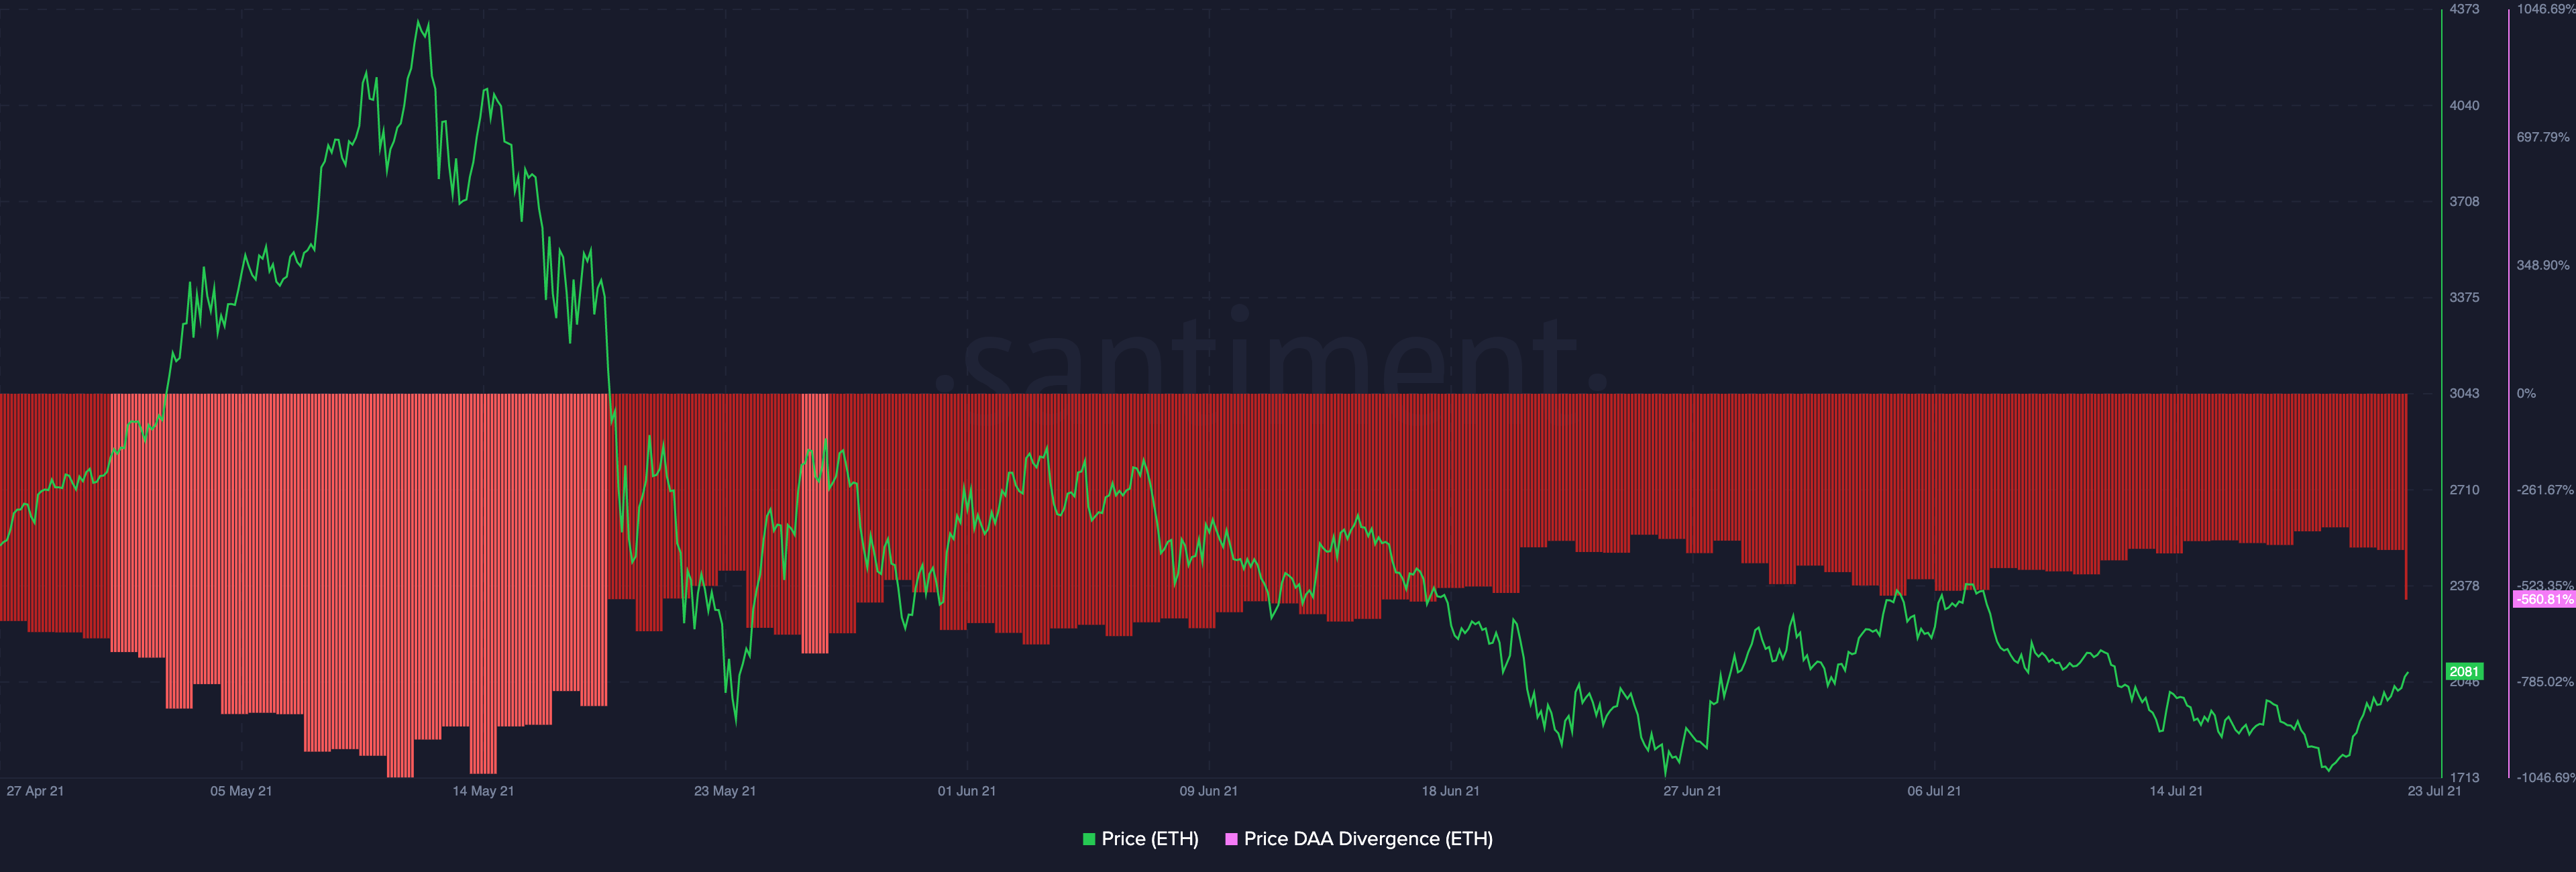
Now, the Price Daily Active Addresses Divergence is a model that tracks the relationship between the altcoin’s price and the number of daily addresses interacting with the same. Whenever the price increases and the number of active addresses declines, the model triggers a “sell” signal.
As can be seen from the attached chart, Ethereum’s price divergence has remained in the bearish zone for quite a few weeks now. In fact, even when its price witnessed a fair rally from 27 June to 8 July, this model flashed a bearish signal. Looking at the state of the drop in the number of addresses and the inflows into exchanges, the current sell signal can be relied upon to a fair extent.
Looking at the not-so-promising signs of recovery, it is fairly conclusive that Ethereum is not out of the woods yet. The alt’s buyers’ momentum would have to pick up the pace for the price to be able to continue its uptrend.
Related Articles


