Supply dynamics suggest Bitcoin can make a run for $100k if…

Bitcoin’s upward trajectory, after getting interrupted by an 18% dip last week, was met with a lot of consolidation. However, as Bitcoin holders looked reluctant to sell-off at a crucial time amid anticipation of a price rise, on-chain metrics offered an interesting insight into the current market sentiment.
Some interesting divergences in BTC’s supply dynamics posed a complex question – Are they projecting bullish or bearish divergences? Ergo, to gauge bullish/bearish signals, it is imperative to weigh the same against market sentiments to understand the crypto’s price trajectory.
Post-halving blast still in the pipeline
Bitcoin to $100k is every holder’s dream and it would be apt to say that this dream might come true. The only question then is this – When? According to a Bloomberg report, there is a simple, yet logical way for Bitcoin to get to $100,000. After last year’s supply cut, the chances of BTC rallying are higher since post-halving years have seen the greatest price appreciation.
A 4x rally in price can push BTC above $100k in the last quarter of 2021. Now, this shouldn’t be a difficult gig for the king coin compared to its 55x gains in 2013 and 15x appreciation in 2017. The only question is whether supply and demand conditions have deteriorated since the start of 2021, in comparison to Bitcoin’s previous post-halving years.
Supply dynamics present a confusing picture
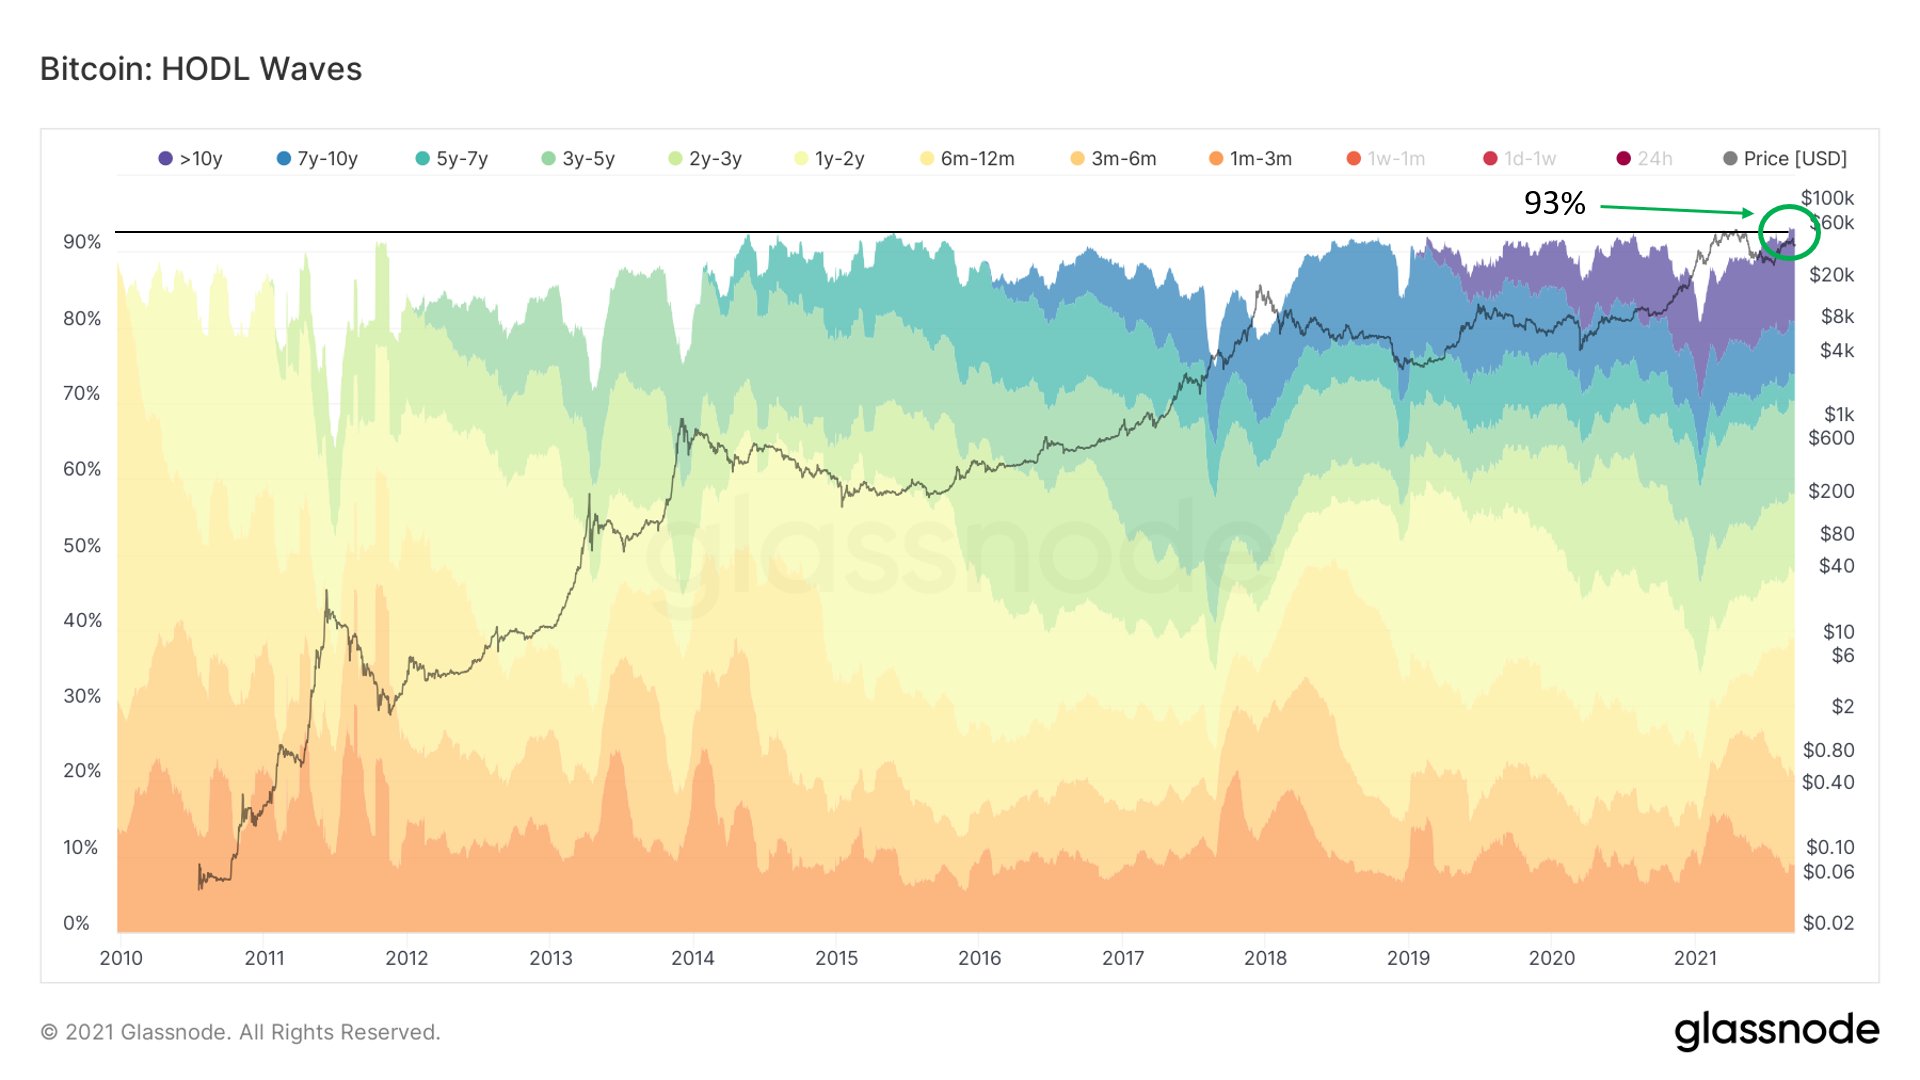
The continuation of extremely robust underlying demand could be pretty constructive for the price. Shedding light on the same, analyst Will Clemente recently pointed out that almost 93% of Bitcoin’s supply hasn’t moved in over a month.
This is an all-time high, one underlining the bullishness of BTC’s supply dynamics of late.
While this is a good short-term bullish approach, looking at HODL waves against the price seems to highlight how the price has gone down with the onset of a bear market after this trend hit an ATH. So, how is this bullish for BTC? And, what is different this time around?
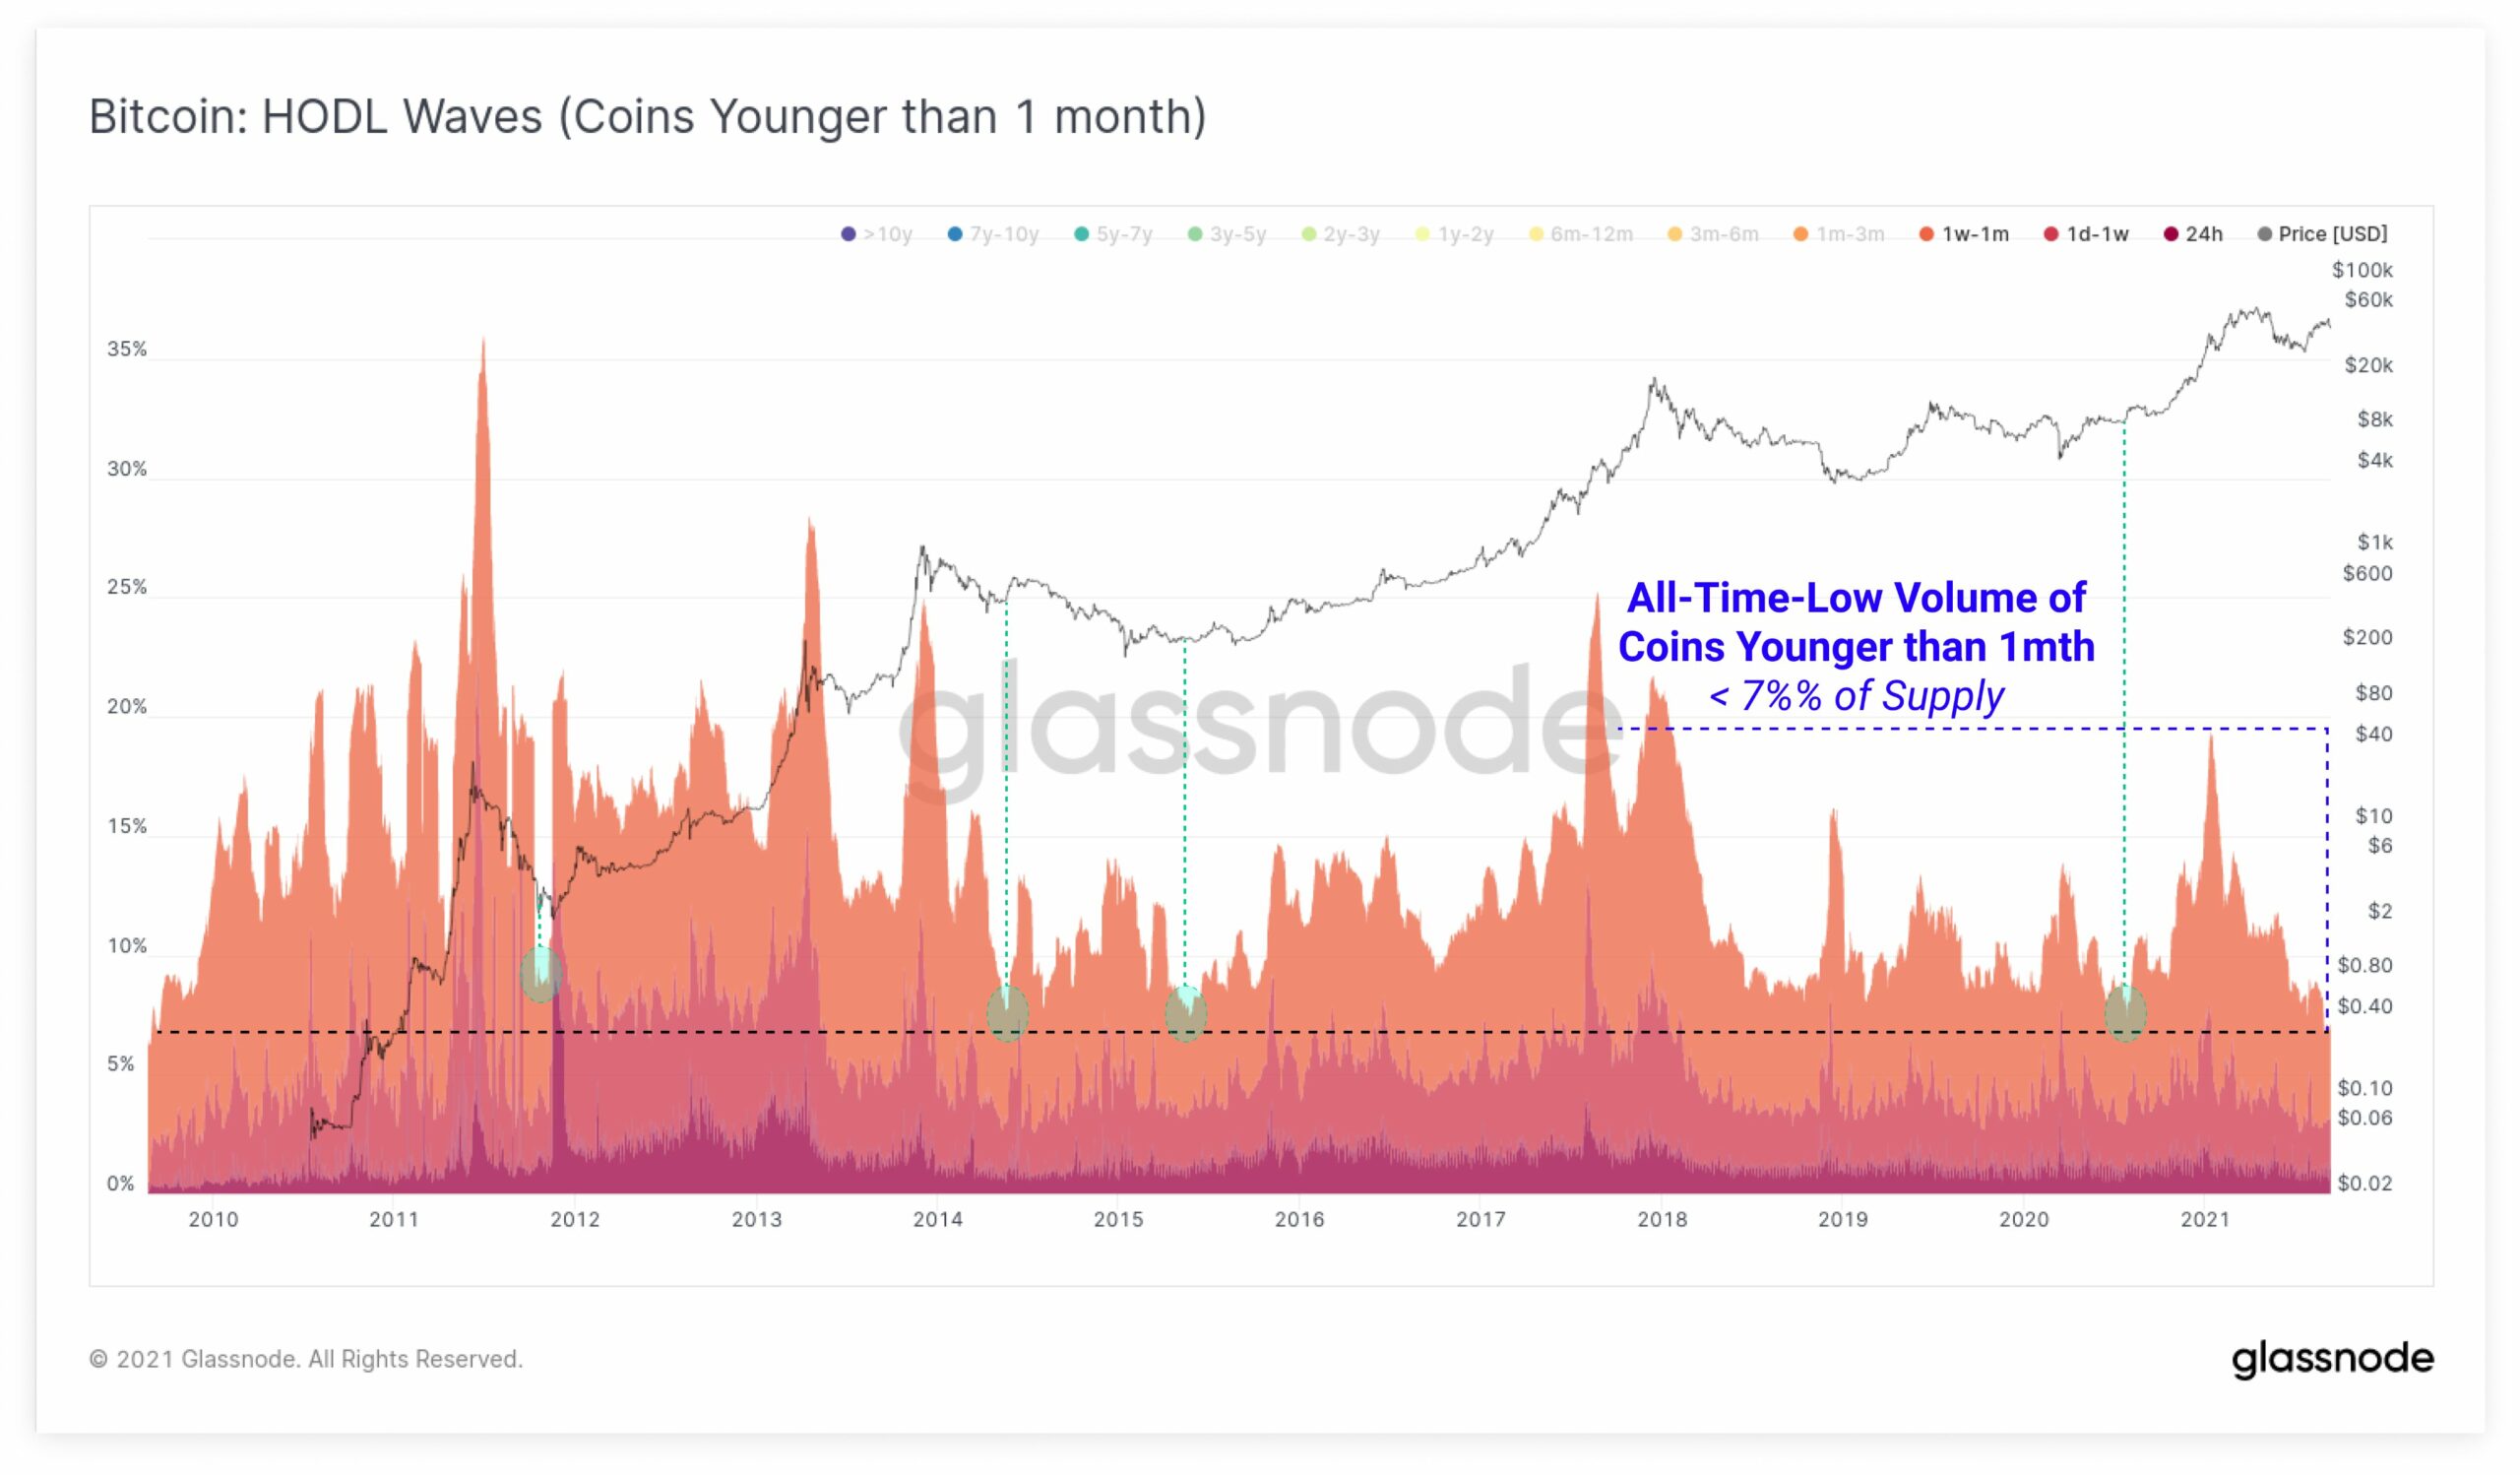
Notably, the volume of Bitcoin younger than one month recently hit an all-time low of less than 7% of the circulating supply. This meant that the volume of coins older than one month was at an all-time high.
In the past, whenever BTC has seen a local low in young coins, three out of the four instances were preceded by full bull markets. On the contrary, one was the 2014 complacency rally before the bear run.
The attached chart can be used to picturize supply broken into age bands. According to the same, the collective number of coins younger than 1 month is less than 7% of the 18.8 million BTC. All in all, these signs seemed bullish in a maturing environment for Bitcoin.
Furthermore, a steady hike in addresses with non-zero balances, in spite of a fall in price, is another good sign for the king coin. Looks like BTC is preparing for some extreme moves – Either BTC will pump like never before or this could be another one in four example.


