Tezos: How this symmetrical triangle could kickstart a rally

Disclaimer: The findings of the following analysis are the sole opinions of the writer and should not be taken as investment advice
Since early September, Tezos’s price has progressed steadily on the chart. The creation of three higher peaks and higher lows identified a healthy uptrend as XTZ ascended to fresh levels in October. At press time, the alt was aiming to revitalize its northbound momentum following a near 30% drawdown from record levels.
A symmetrical triangle setup presented bulls with the opportunity to kickstart the next leg forward and target a comeback to $8. At the time of writing, XTZ was trading at $6.95, down by 0.6% over the last 24 hours.
Tezos 4-hour Chart
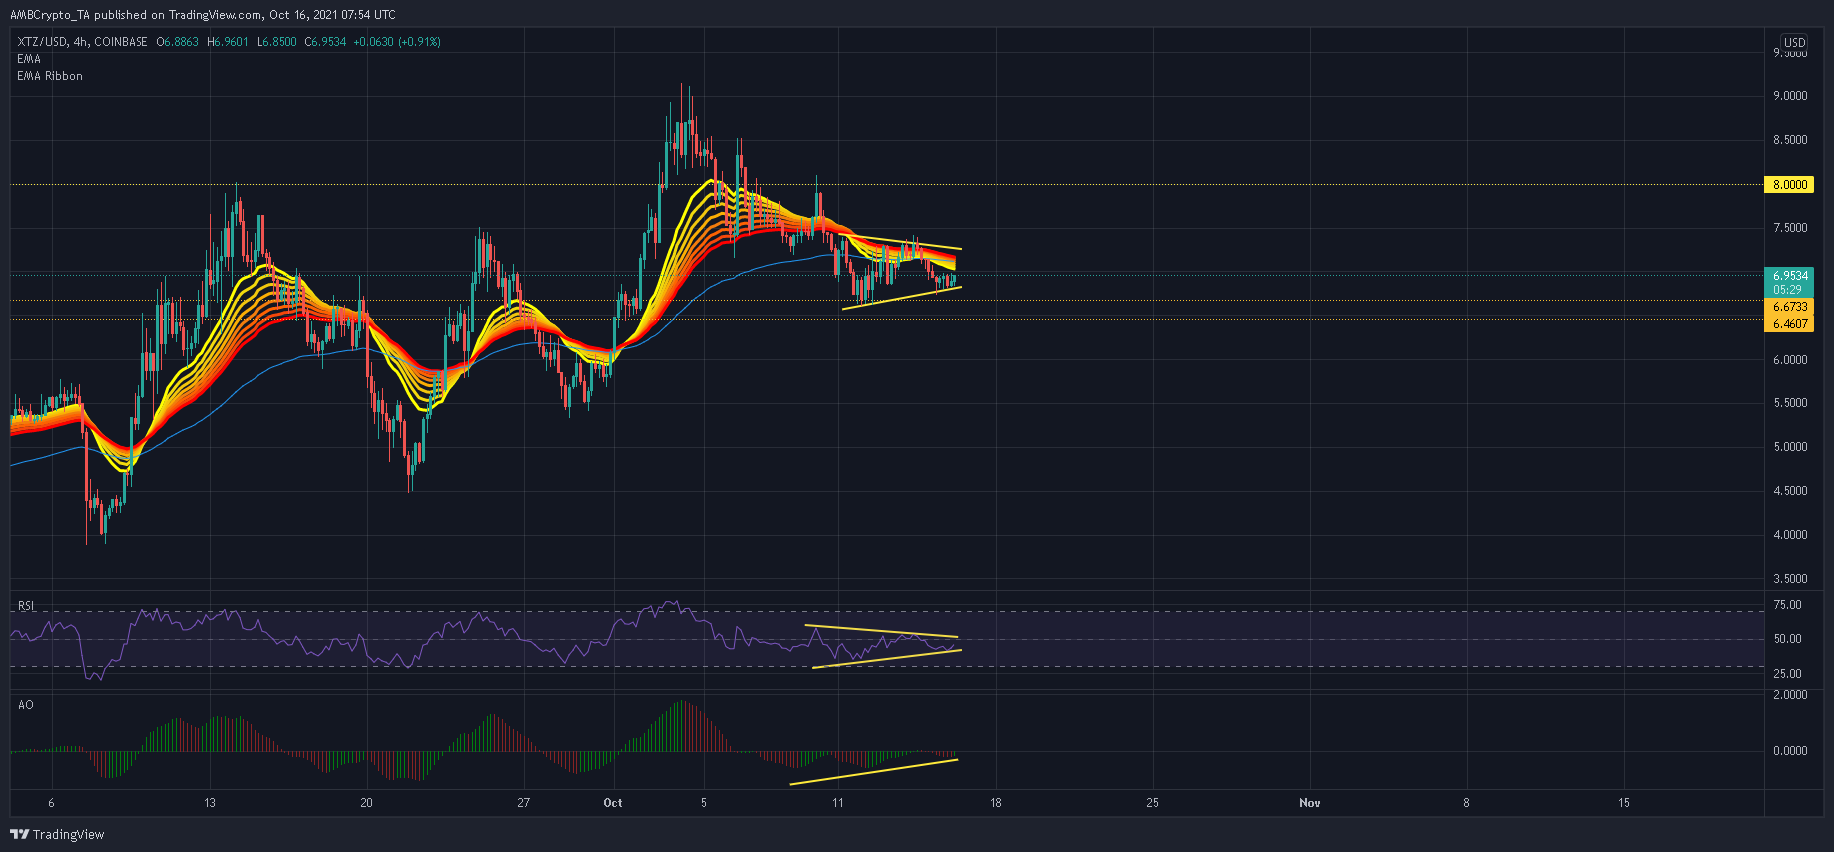
The last 3 correctional waves have been strong in the Tezos market. Losses during each wave amounted to 44%, 27%, and 28% and saw XTZ shift below its 4-hour EMA Ribbons on each occasion. However, the bullish response has been timely and upcycles have followed almost instantly following these corrections.
Now that XTZ is again below its EMA Ribbons, a symmetrical triangle setup presented an ideal opportunity for the next upswing.
Over the near term, XTZ will need to retake $7.2 and target another attack at the upper trendline. A close above $7.43 on healthy volumes would confirm a breakout from the pattern. Based on the highs and lows within the pattern, a near 12% rally awaited XTZ from the breakout. This would allow XTZ to tag the $8-mark and hunt more aggressively for higher price levels.
On the other hand, a close below $6.74 would see bears get in on the action. A breakout in the opposite direction would highlight near-term support levels of $6.46 and $6.01.
Reasoning
Although XTZ’s indicators eased around the mid-line, each traded within bullish setups. For instance, the Awesome Oscillator eyed a potential surge after forming a bullish twin peak while the Relative Strength Index traded within a symmetrical triangle of its own.
If buyers respond to these signals, a massive surge of upwards pressure will be due for XTZ.
Conclusion
XTZ could tag the $8-mark on the back of a symmetrical triangle breakout. Traders can long this setup once XTZ closes above $7.43 on strong volumes. Stop-losses can be set at $6.67.


