Traders need to factor in these aspects when it comes to Solana’s price trajectory

Since its staggering rally in September, Solana has been unable to any deliver fresh highs to add to its burgeoning repertoire. In fact, its value has whittled steadily on the chart and was currently trading at a 23% discount to its ATH.
Although a bullish start to October looked promising, SOL could not carry above the 61.8% Fibonacci level to stretch its gains to a new ATH. Now bulls did have an opportunity to overturn this scenario.
SOL was working towards an up-channel breakout but had to negotiate past a tricky resistance to realize its full potential. At the time of writing, SOL traded at $161.4, up by 1.1% over the last 24 hours.
SOL 4-hour Chart
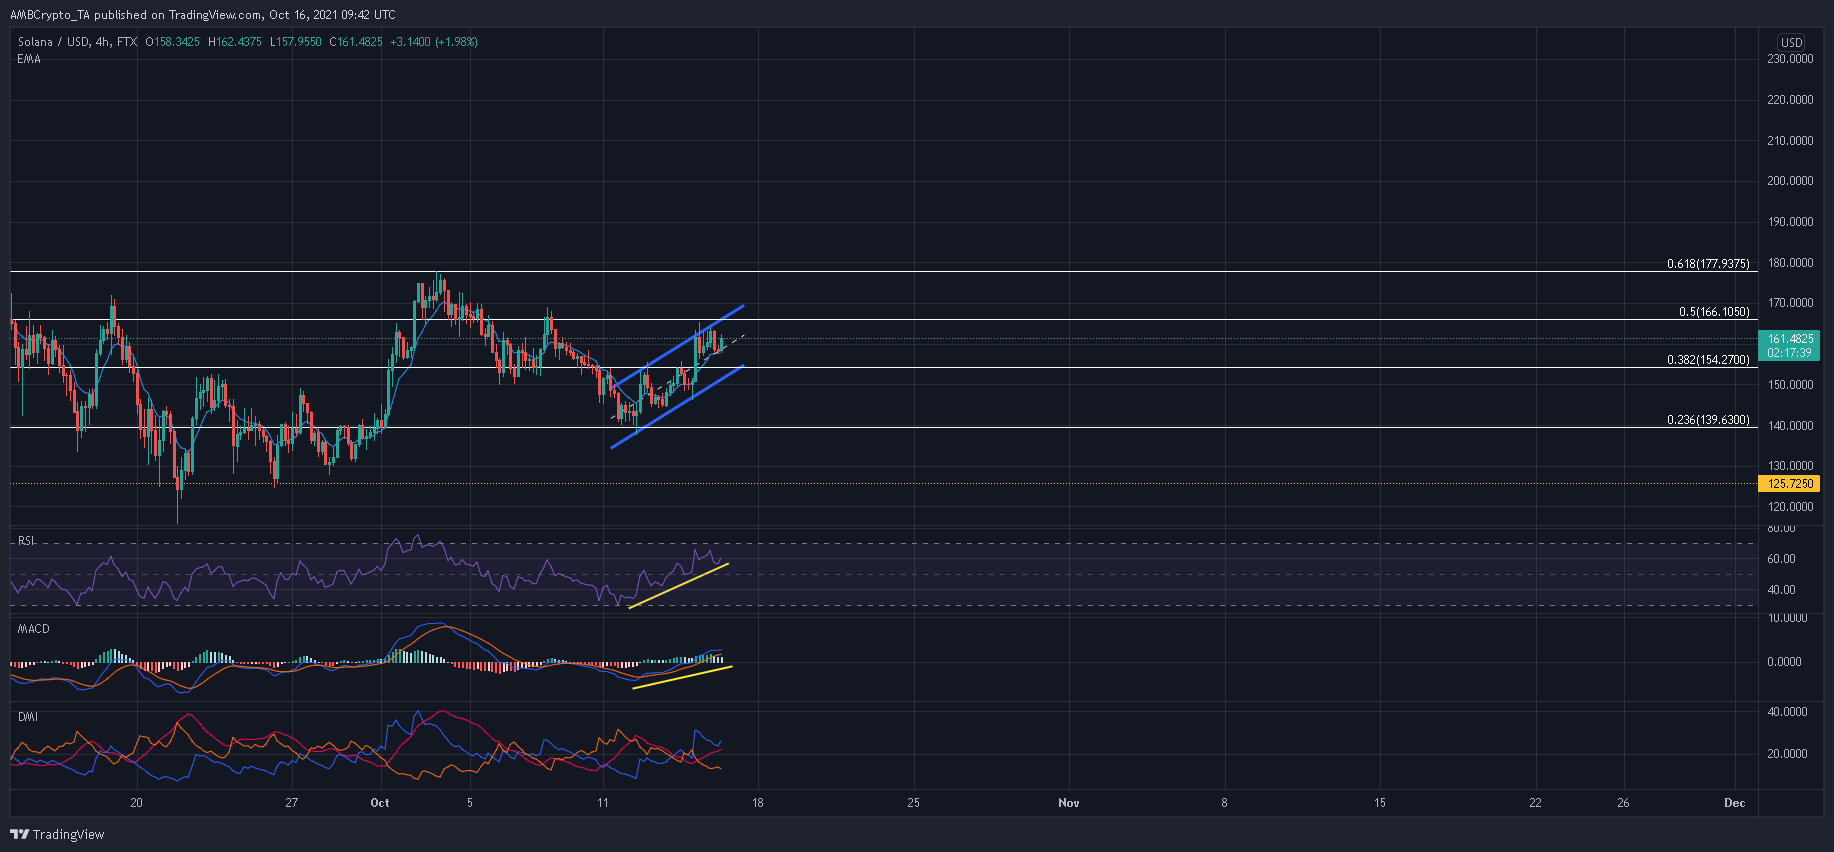
Since SOL was trading above the 9 EMA (blue), near-term momentum aided the buying side. A reversal at the mid-line of the pattern would see SOL formulate a fourth attack at the upper trendline. Now the confluence of this upper trendline and the 50% Fibonacci level at $166.1 could keep SOL grounded within the pattern.
However, if bulls can clear this tricky barrier with healthy volumes to back its movement, SOL could see an instant 7.5%-8% uptick in price. Sellers could then answer back at a potential double top formation at the 61.8% Fibonacci level.
A breakdown from the pattern would require a sustained bearish effort. The Visible Range’s POC close to the 38.2% Fibonacci level formed a sturdy support which would look to prevent extended drawdowns in the market.
Reasoning
Based on the Directional Movement Index’s bullish crossover and steady highs along the MACD, bulls presented a valid argument for an upwards breakout. However, the RSI was close to the upper zone. An uptick to the 50% Fibonacci level coupled with an overbought reading on the RSI could invite some profit-taking moving forward.
Conclusion
It was uncertain whether SOL would break north from its up-channel, especially considering weak 24-hour trading volumes. Since the RSI was close to overbought levels as well, expect SOL to reverse at the 50% Fibonacci level and form a new low at the lower trendline.