Bitcoin Cash ready for an extended recovery but…

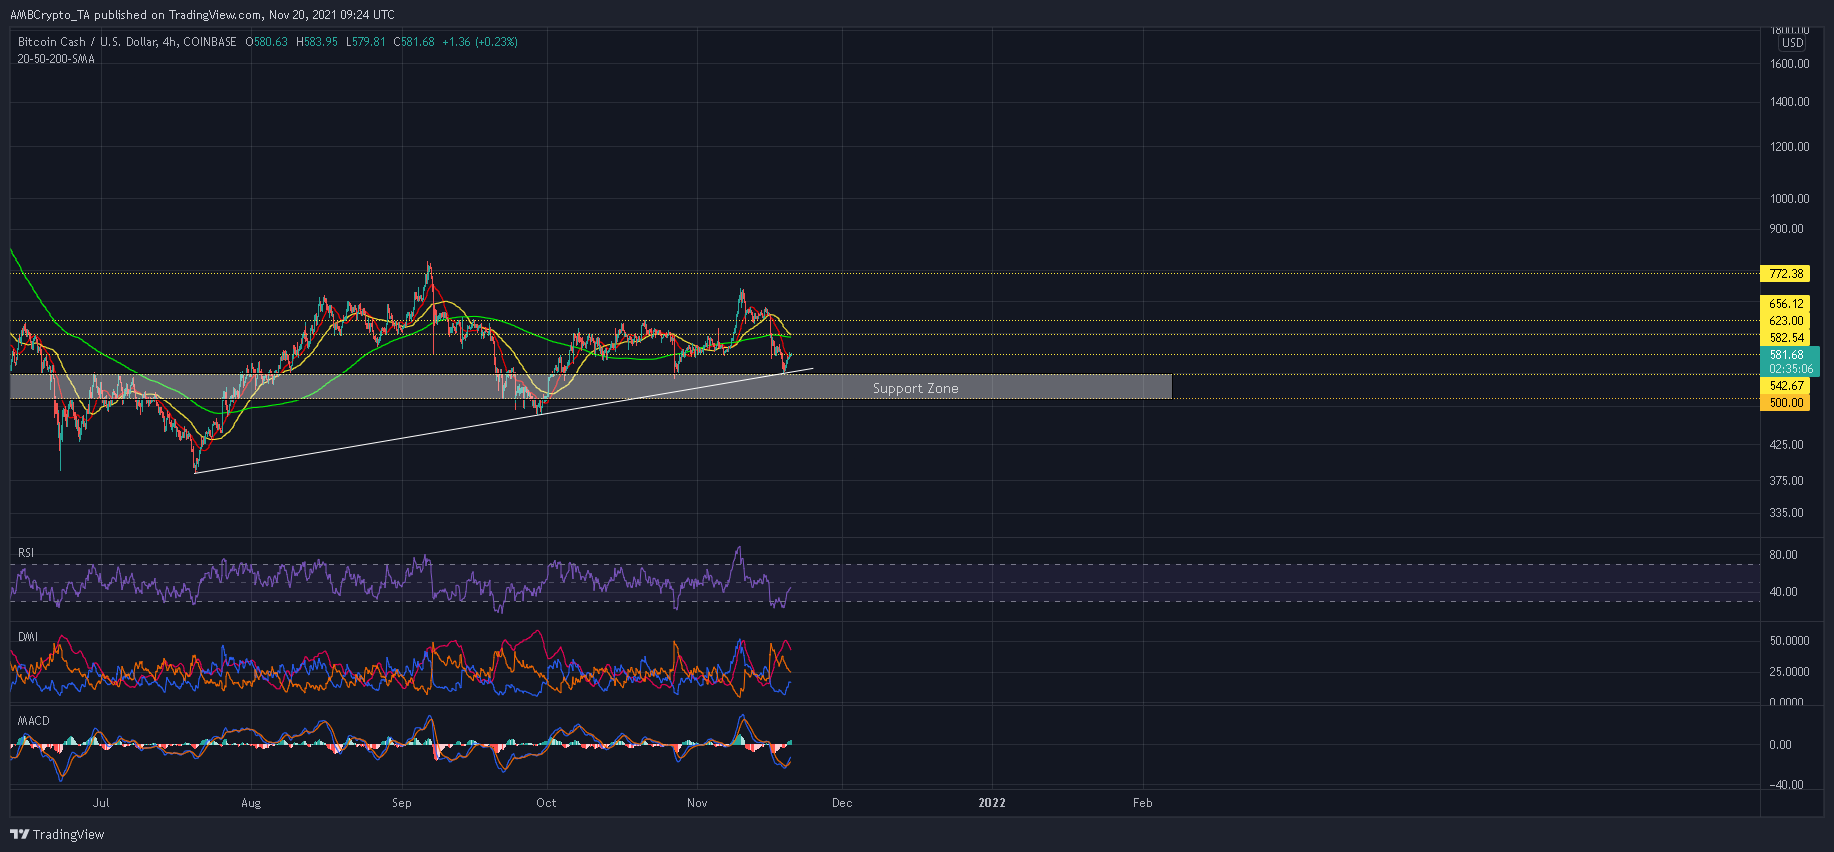
While the last 8 days have been rough for Bitcoin Cash, its streak of higher lows remained intact. Following a 26% decline between 11-18 November, a bullish crossover along the MACD and an oversold RSI underpinned BCH’s recovery.
The last couple of days have accounted for an 8% surge and more upside awaits BCH over the near-term. At the time of writing, BCH traded at $581.7, up by 3.2% over the last 24 hours.
Bitcoin Cash 4-hour Chart
Bitcoin Cash has respected the boundaries of a lower sloping trendline which has extended all the way from July lows. After a third point of contact at $542-support, BCH lined up six green candles, spaced out by a solitary doji candlestick (now shown) which failed to halt a bullish comeback.
With momentum now with bulls after a close above the 20-SMA (red), BCH look set to challenge its near-term price ceiling at $580. However, expect some profit-taking once BCH tags $623-resistance. The confluence of the 50-SMA (yellow) and 200-SMA (green) would deny an extended push towards the next targets at $656 and $772.
On the flip side, should the immediate ceiling of $580 restrict BCH’s trajectory, some sideways action can be expected between sell pressure fizzles out. Support at $500 would be ready to counteract any deeper sell-off attempts.
Reasoning
Following a double bottom in the oversold region, the 4-hour RSI was retaking ground over the past few days. If the index does move above 55-60, new longs would be introduced in the market.
Similarly, the MACD eyed a move above its half-line after registering a bullish crossover just 24 hours ago. The Directional Movement Index was also on the precipice of conceding its bearish stance.
Conclusion
BCH could add a further 7% to its value as the RSI and MACD continue to recuperate. Once BCH tests the confluence of its 20-SMA (red) and 200-SMA (green) at $623-resistance, a minor correction was anticipated before the next leg forward.


