Cardano, Tron, Dash Price Analysis: 25 November

Fascinating contradictions were witnessed as the market projected a classic bull versus bear tug of war.
Cardano has not been performing well, and it continues its bearish streak with slight chances of a bullish revival. On the other hand, Tron and DASH have steadily traversed in an up-channel and obliged their respective trendlines.
Cardano (ADA)
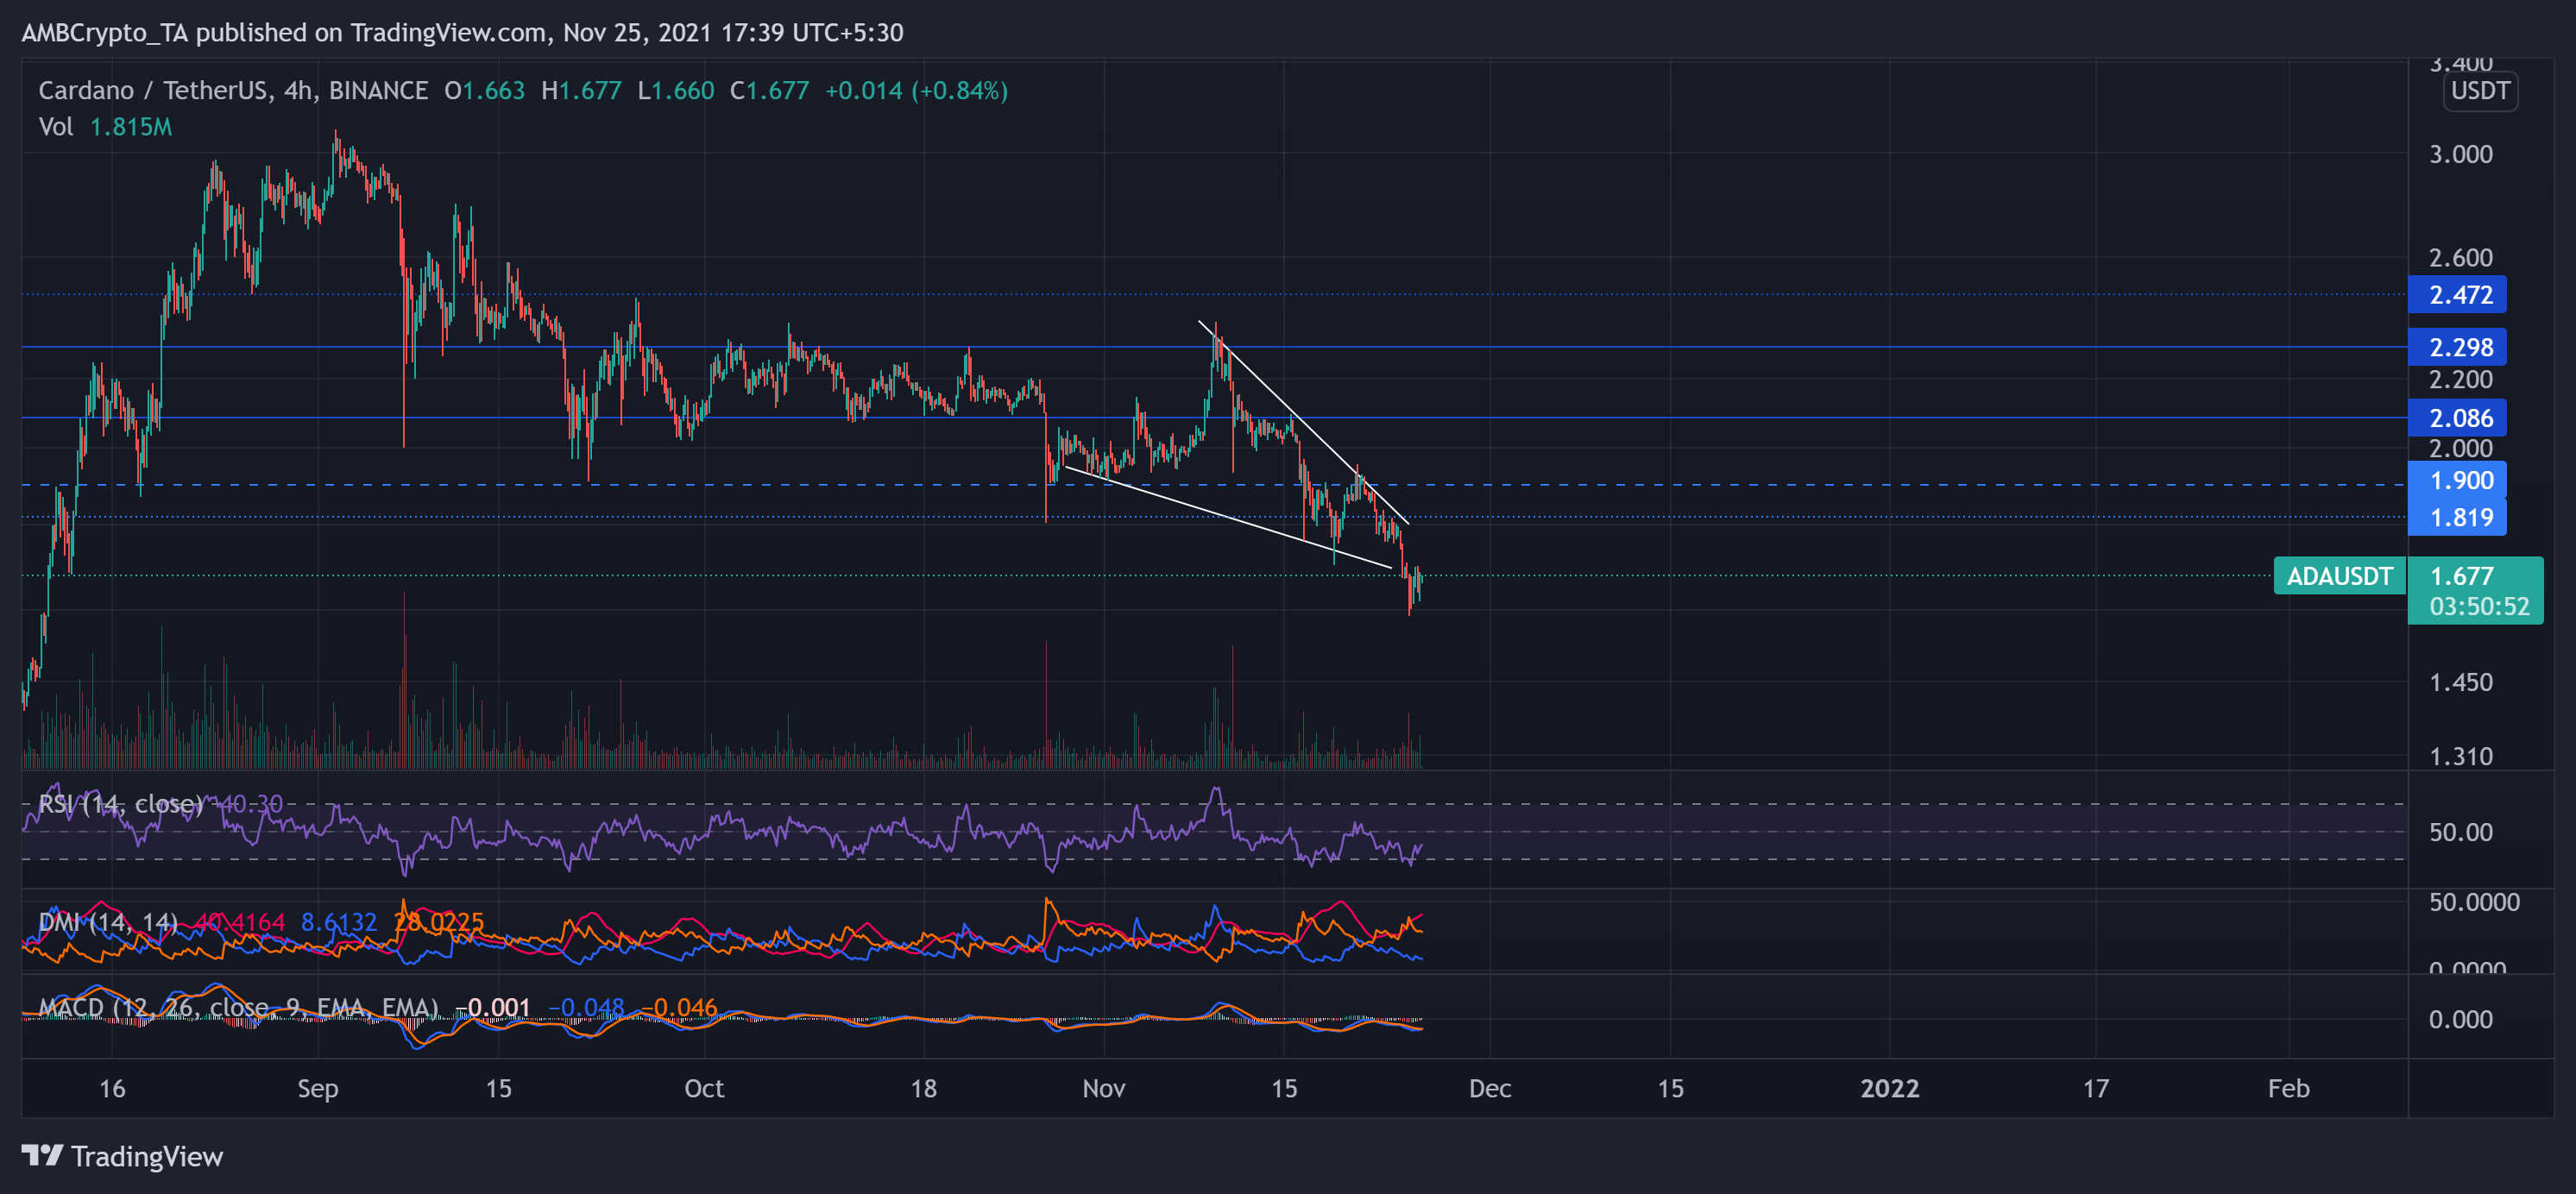
ADA witnessed a steady withdrawal since early September itself. The crypto registered a 41.34% decline from 2 September until it touched its 11-week low on 27 October. After which, the bulls triggered an uptrend to hit its one-month high on 9 November.
However, bulls failed to sustain their advantage as the price fell into its long-term trend and plunged. The sell-off led to a price dip of 28.68% from 9 to 23 November. Consequently, the price poked its 15-week low on 24 November.
At press time, ADA was trading at $1.1677. The RSI chose the sellers by swaying near the 40-mark. However, it showed slight revival signs over the past day. Although DMI preferred the bearish vigor, the MACD hinted at a bullish revival. For a comeback, bulls will have to gather momentum at increased trading volumes.
Tron (TRX)

TRX stood on the opposite spectrum of ADA. While ADA steadily backtracked, TRX swayed between the parallel channels heading north. It undertook the ascent Since 29 September while recording an over 54% 47-day ROI. Consequently, the rally triggered the price to its six-month high on 15 November.
However, the bears rebutted by showing resistance at the upper channel. As a result, the price moved back into the trend after noting an 11.1% seven-day decline and traded at $0.09968. After the bears countered the bullish vigor, they breached the $1.0335-mark (immediate resistance).
The near-term technicals showed bullish revival signs after preferring the bears. The RSI surged toward the midline after jumping by 10 points in 24 hours. This jump indicated the increasing buying momentum. Also, the MACD and AO depicted a revival possibility by flashing green signs and resonated with the RSI jump.
DASH
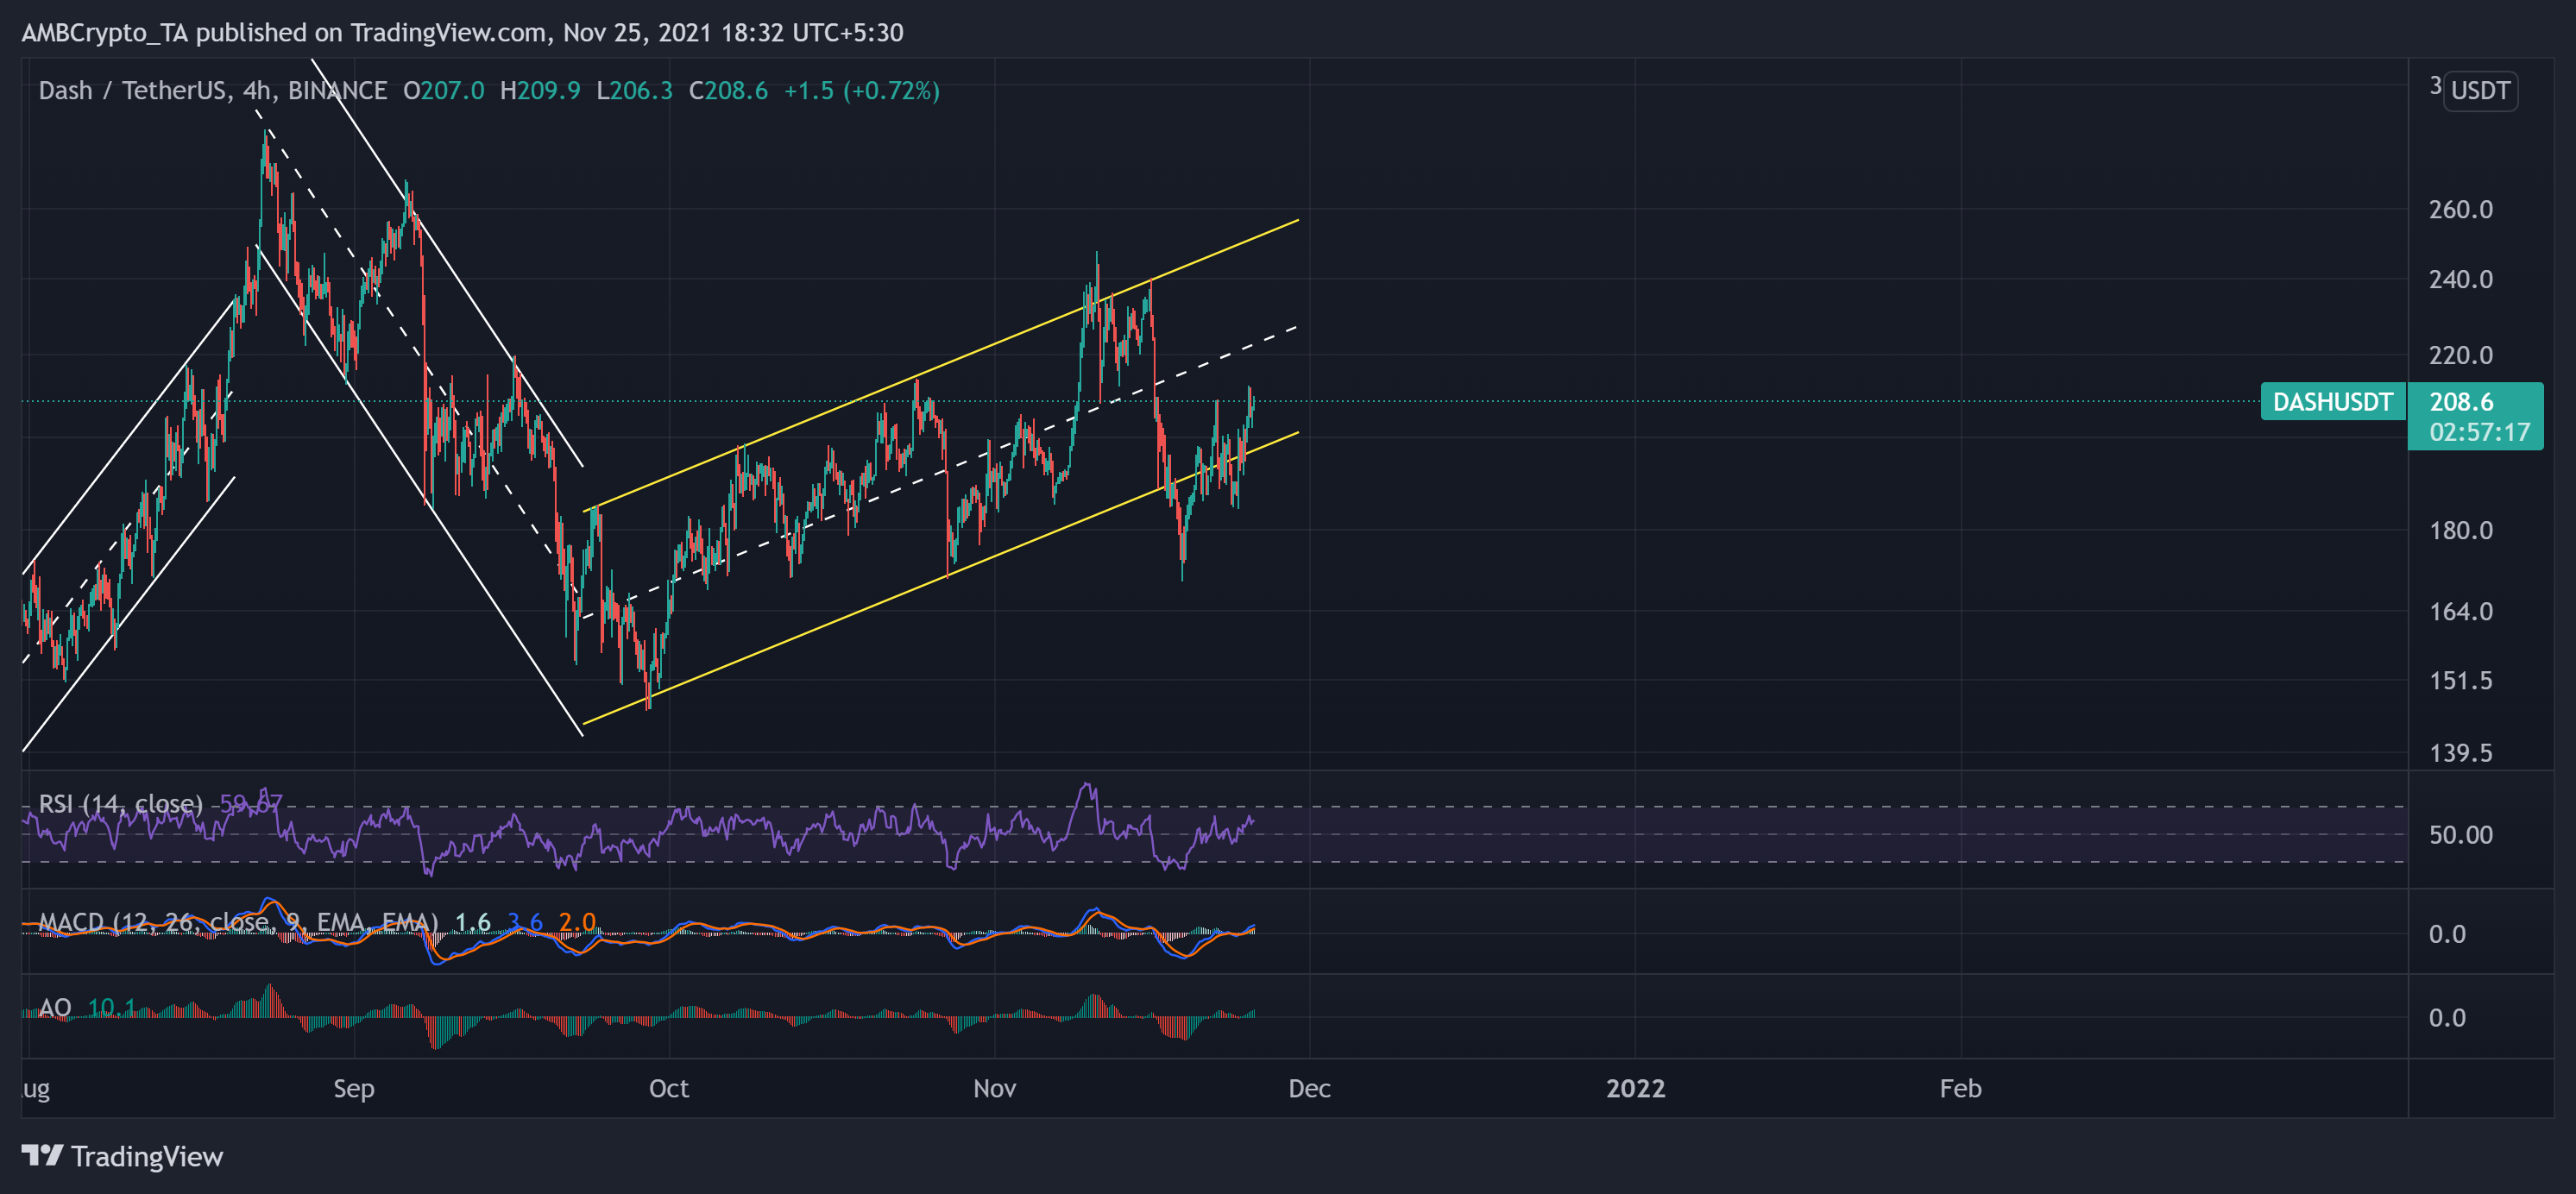
Like TRX, DASH exhibited an uptrend from late September. Since 29 September, DASH price action undertook a bullish trajectory as the price bounced between the two parallel lines heading north. The digital currency noted a monstrous 64.4% ROI from 29 September to 10 November. As a result, DASH reached its two-month high on 10 November and bounced back between the parallel lines following the trend.
Then, the altcoin saw a steep plunge over the next week as it marked a 30.31 decline to poke its six-week low on 18 November.
However, the altcoin registered a 9.2% weekly gain as near-term technicals point at increasing bullish momentum. At press time, DASH traded at $208.6. The RSI was northbound and visibly preferred the bullish side. Also, the MACD and AO depicted a revival possibility by flashing green signs.