Solana, Chainlink, Enjin coin Price Analysis: 2 December

After a substantial sell-off, most cryptos touched their multi-week lows on 28 November. Now, as the bulls try to negate the selling pressure, Solana and Chainlink registered double-digit gains over the past four days.
Enjin coin, on the other hand, after defying the market trend, registered a 24.6% weekly loss.
Solana (SOL)
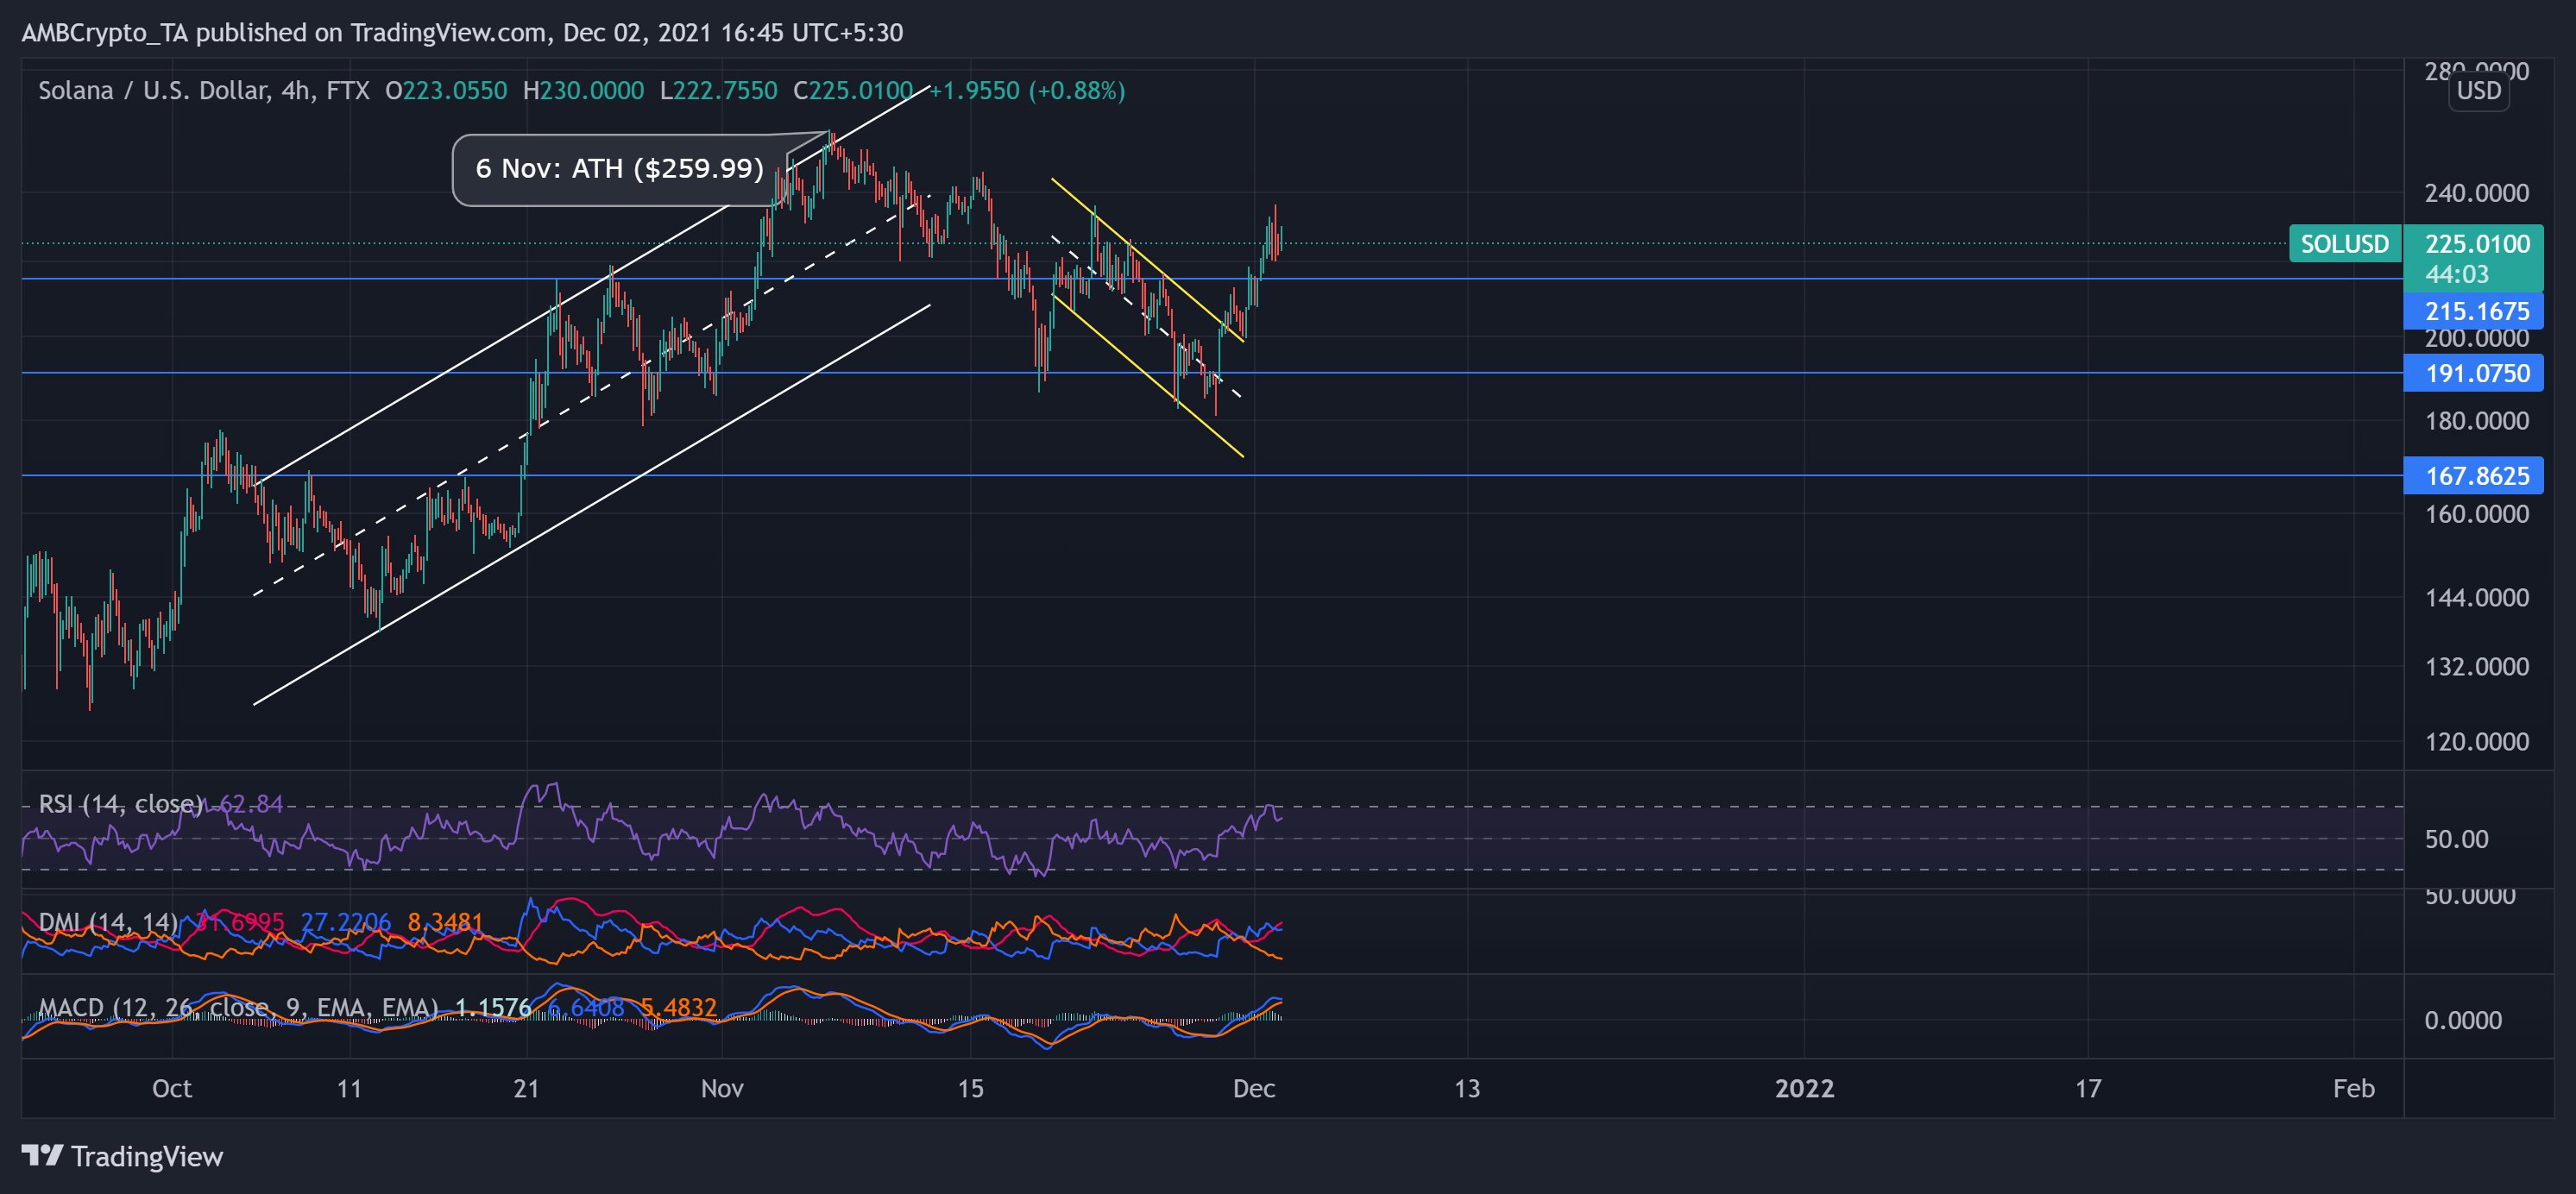
SOL relished an upswing trajectory from mid-October until early November. It rallied by over 85% from 12 October to 6 November. With this upturn, the altcoin struck its ATH on 6 November.
Then, the price steadily declined in a descending channel as bulls failed to counter the sell-off. During the downfall, SOL lost over one-fourth of its value until it touched its one-month low on 28 November.
However, at press time, SOL traded at $225.01 after noting a 23.8% 4-day gain. This upswing led to a down-channel breakout as the bulls breached the $215-mark (immediate support).
The RSI favored the bulls after moving near the 62-mark after almost a month. Also, the DMI flashed a bullish bias. However, MACD hinted at their slightly decreasing strength in the near term.
Chainlink (LINK)
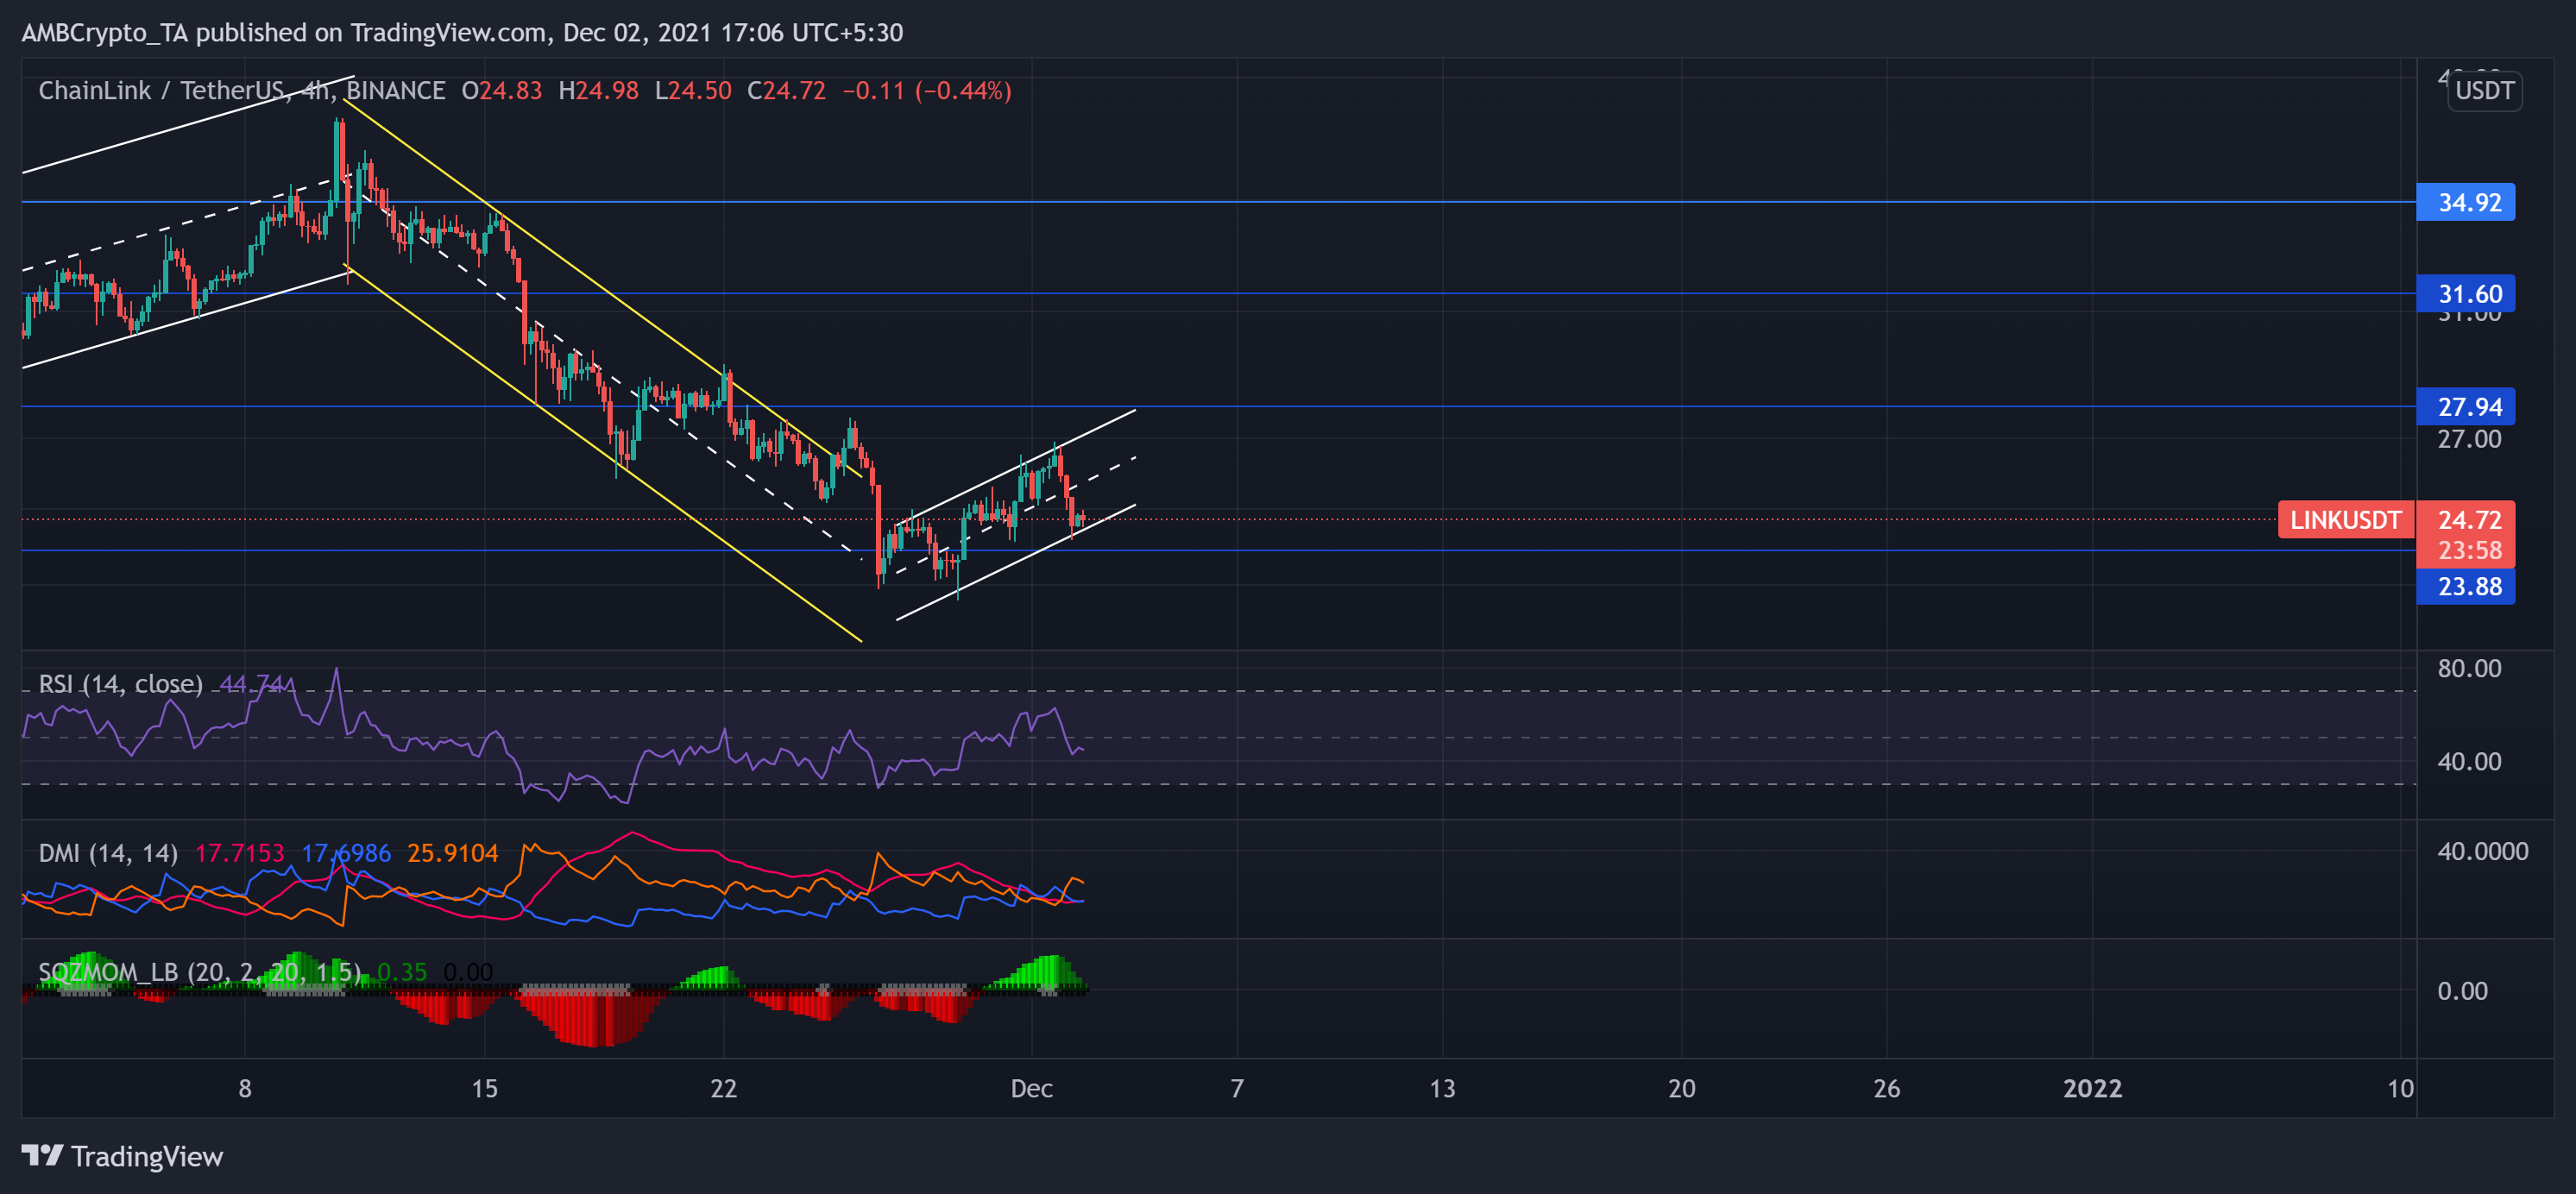
The alt upturned after noting a monstrous 62.08% ROI from 12 October to 10 November. With this, the bulls hit the six-month high on 10 November at $38.31. Since then, bears triggered a downfall as the price moved between the descending channel (yellow).
During this sell-off phase, LINK lost over 40% of its value. Consequently, it touched its eight-week low on 28 November. Thereafter, the bulls attempted a revival by marking an 18% rally from 28 November to 1 December. But the price action obliged the trend as it bounced back from the upper line of the ascending channel.
At press time, LINK traded at $24.72 after noting a nearly 6% 24-hour loss.
The RSI showed a bearish advantage after a sharp plunge. Furthermore, bearish readings on the DMI reaffirmed the pullback. However, the Squeeze Momentum Indicator flashed black dots, hinting at a squeeze phase with low volatility. Now, the bulls will have to ensure support at the lower channel to prevent an up-channel breakdown.
Enjin Coin (ENJ)

Unlike most cryptos, ENJ steadily oscillated in an ascending channel since late September. ENJ registered an exceptional gain of over 250% from 30 September to 25 November. Consequently, ENJ attained its ATH on 25 November after a sustained bull rally.
Since then, the price returned within the bounds of the channel as bears retaliated. As a result, the alt noted a nearly 24.6% decline over the past week and traded at $3.374 at press time.
The RSI was southbound and stayed below the half-line for the past seven days. Also, the DMI and AO visibly preferred the selling strength. Nonetheless, the ADX displayed a weak directional trend.