Ethereum, SAND, Chainlink Price Analysis: 26 December

The last week marked a reasonable recovery while Ethereum and Chainlink poked their two-week highs on 24 December. Ethereum seemed to hold the $4,000 mark and now strove to test its immediate resistance.
SAND touched its three-week high on 26 December after forming a rising wedge (reversal) pattern.
Ethereum (ETH)
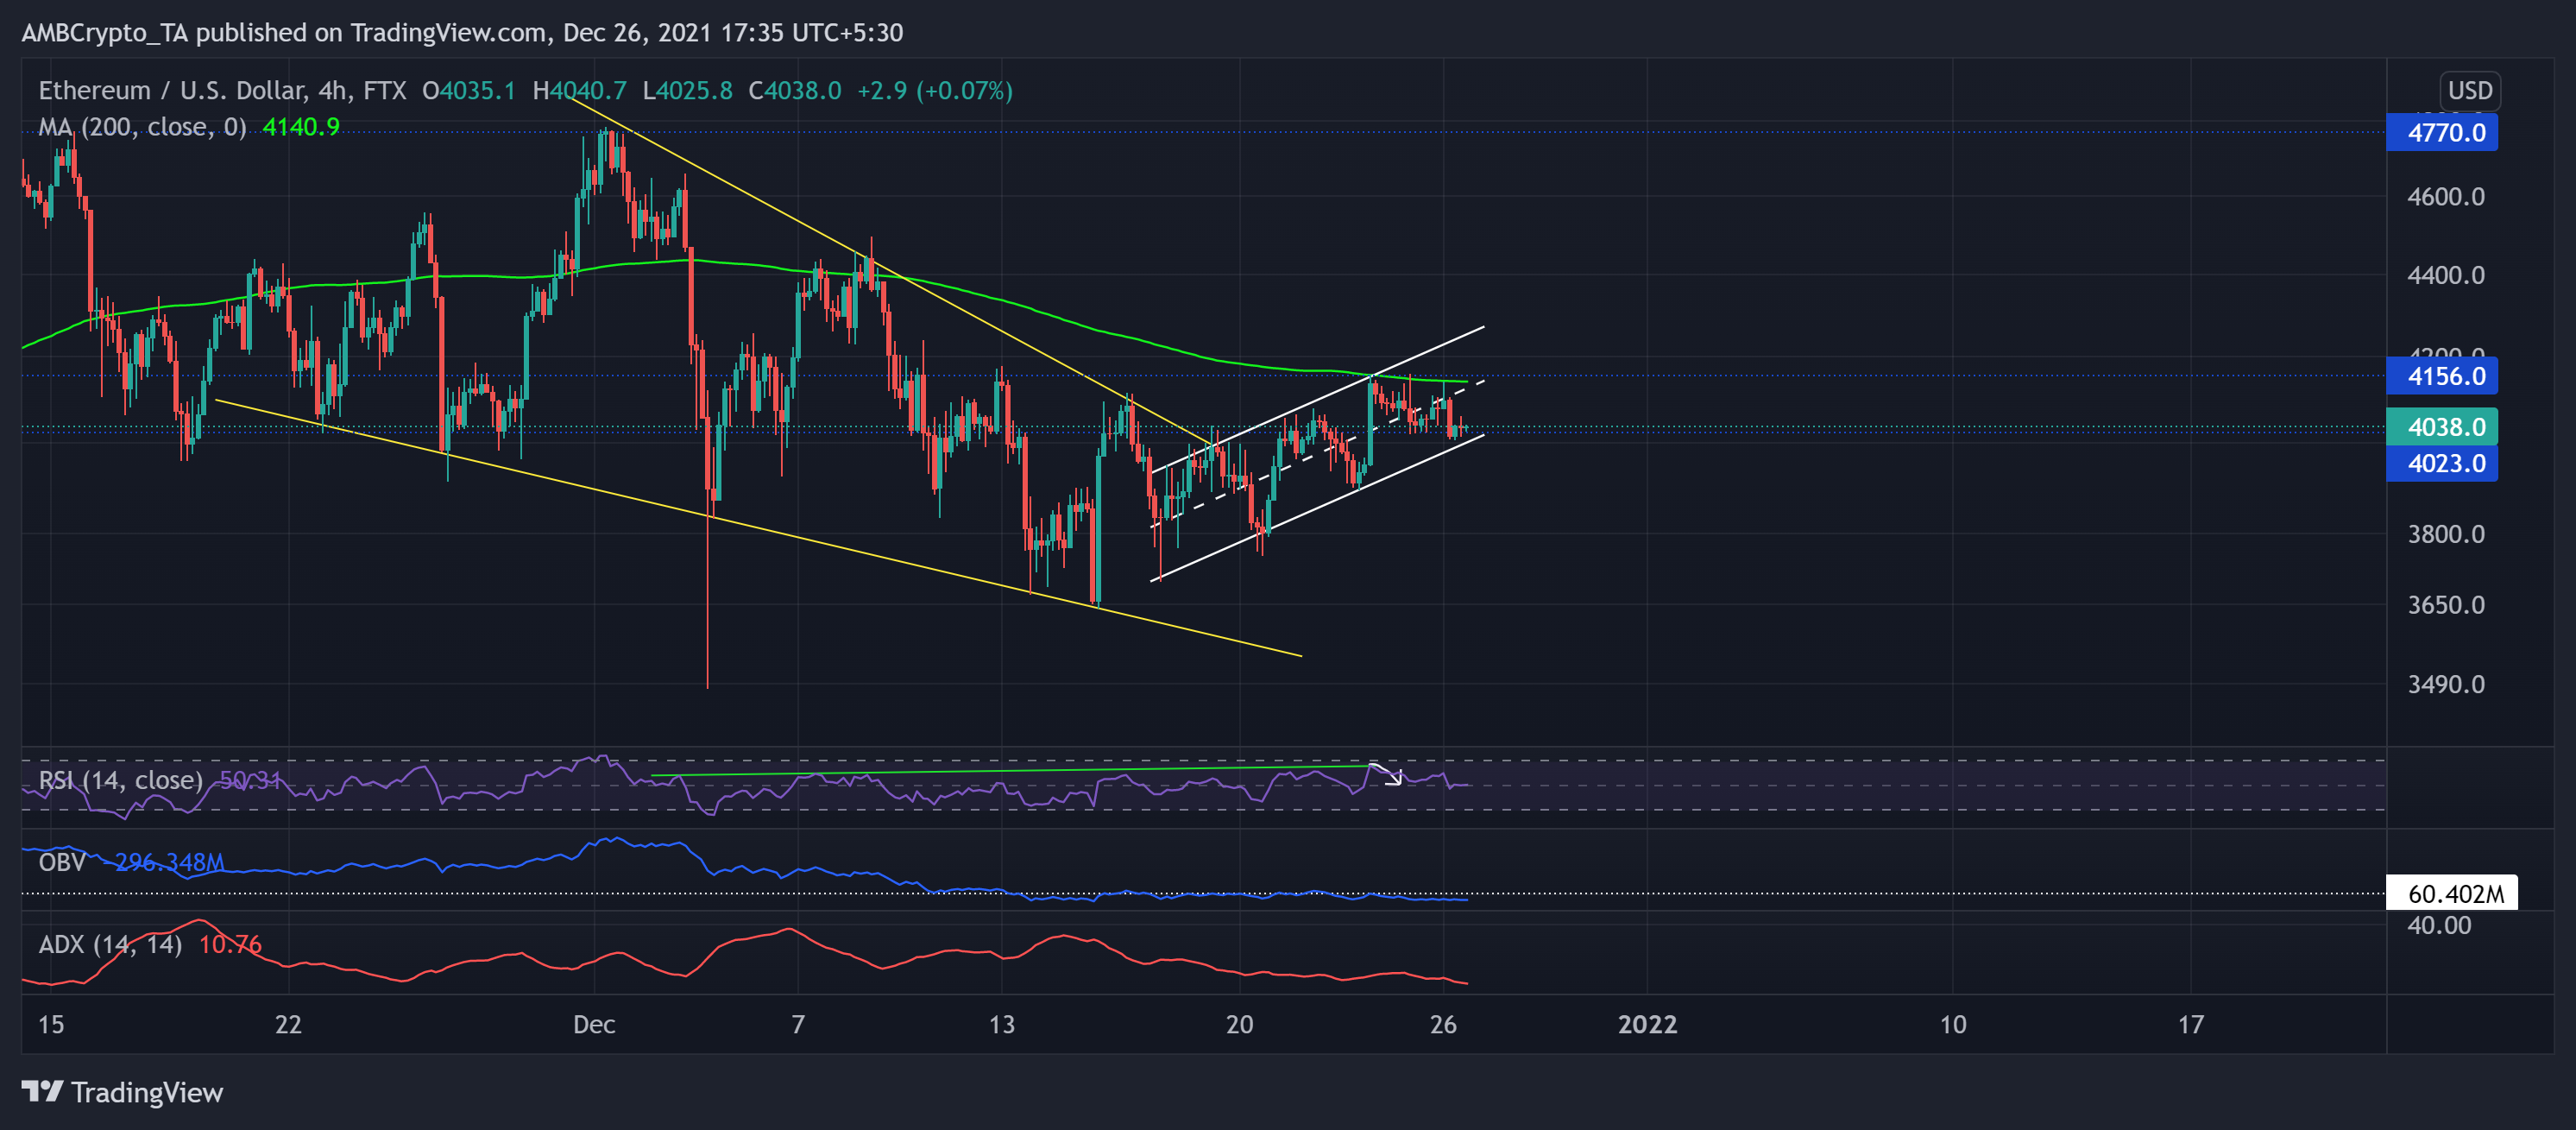
Over the past nine days, ETH oscillated in an up-channel (white) and reclaimed the crucial $4000-mark support.
ETH grew by nearly 11.9% (from 17 December low) and poked its two-week high on 25 December. The bulls managed to sustain the price above the $4000-level while the bears tested it twice in the last two days.
The rally continued to find resistance at the $4,156-mark that coincided with the upper channel (white) and 200-SMA (green). Now, the immediate testing support stood at the $4,000-level.
At press time, ETH traded at $4,038. The RSI saw a pullout after poking the 66-point and now swayed near the 48-mark. However, The OBV did not correspond with the uptrend. Also, the broader directional strength for ETH remained substantially weak as per the ADX.
The Sandbox (SAND)
Since 5 December, SAND fell in a down-channel (yellow) on its 4-hour chart. AS the bulls tested the upper channel multiple times, it finally saw a down-channel breakout.
SAND bulls crossed the 38.2% Fibonacci resistance as it reclaimed the crucial $6.03 support after forming a rising wedge (green, reversal pattern). As a result, it poked its three-week high on 26 December.
Now, the 61.8% Fibonacci stood as a strong resistance. Any breakdown from here would see testing support near the $6.03-level.
At press time, the alt traded at $6.7141 after noting a 7.35% 24-hour gain. The RSI was at the 71-mark and displayed a sweeping bullish bias. Considering the overbought RSI threat and the reversal pattern, it would only be natural to witness a near-term setback.
Chainlink (LINK)
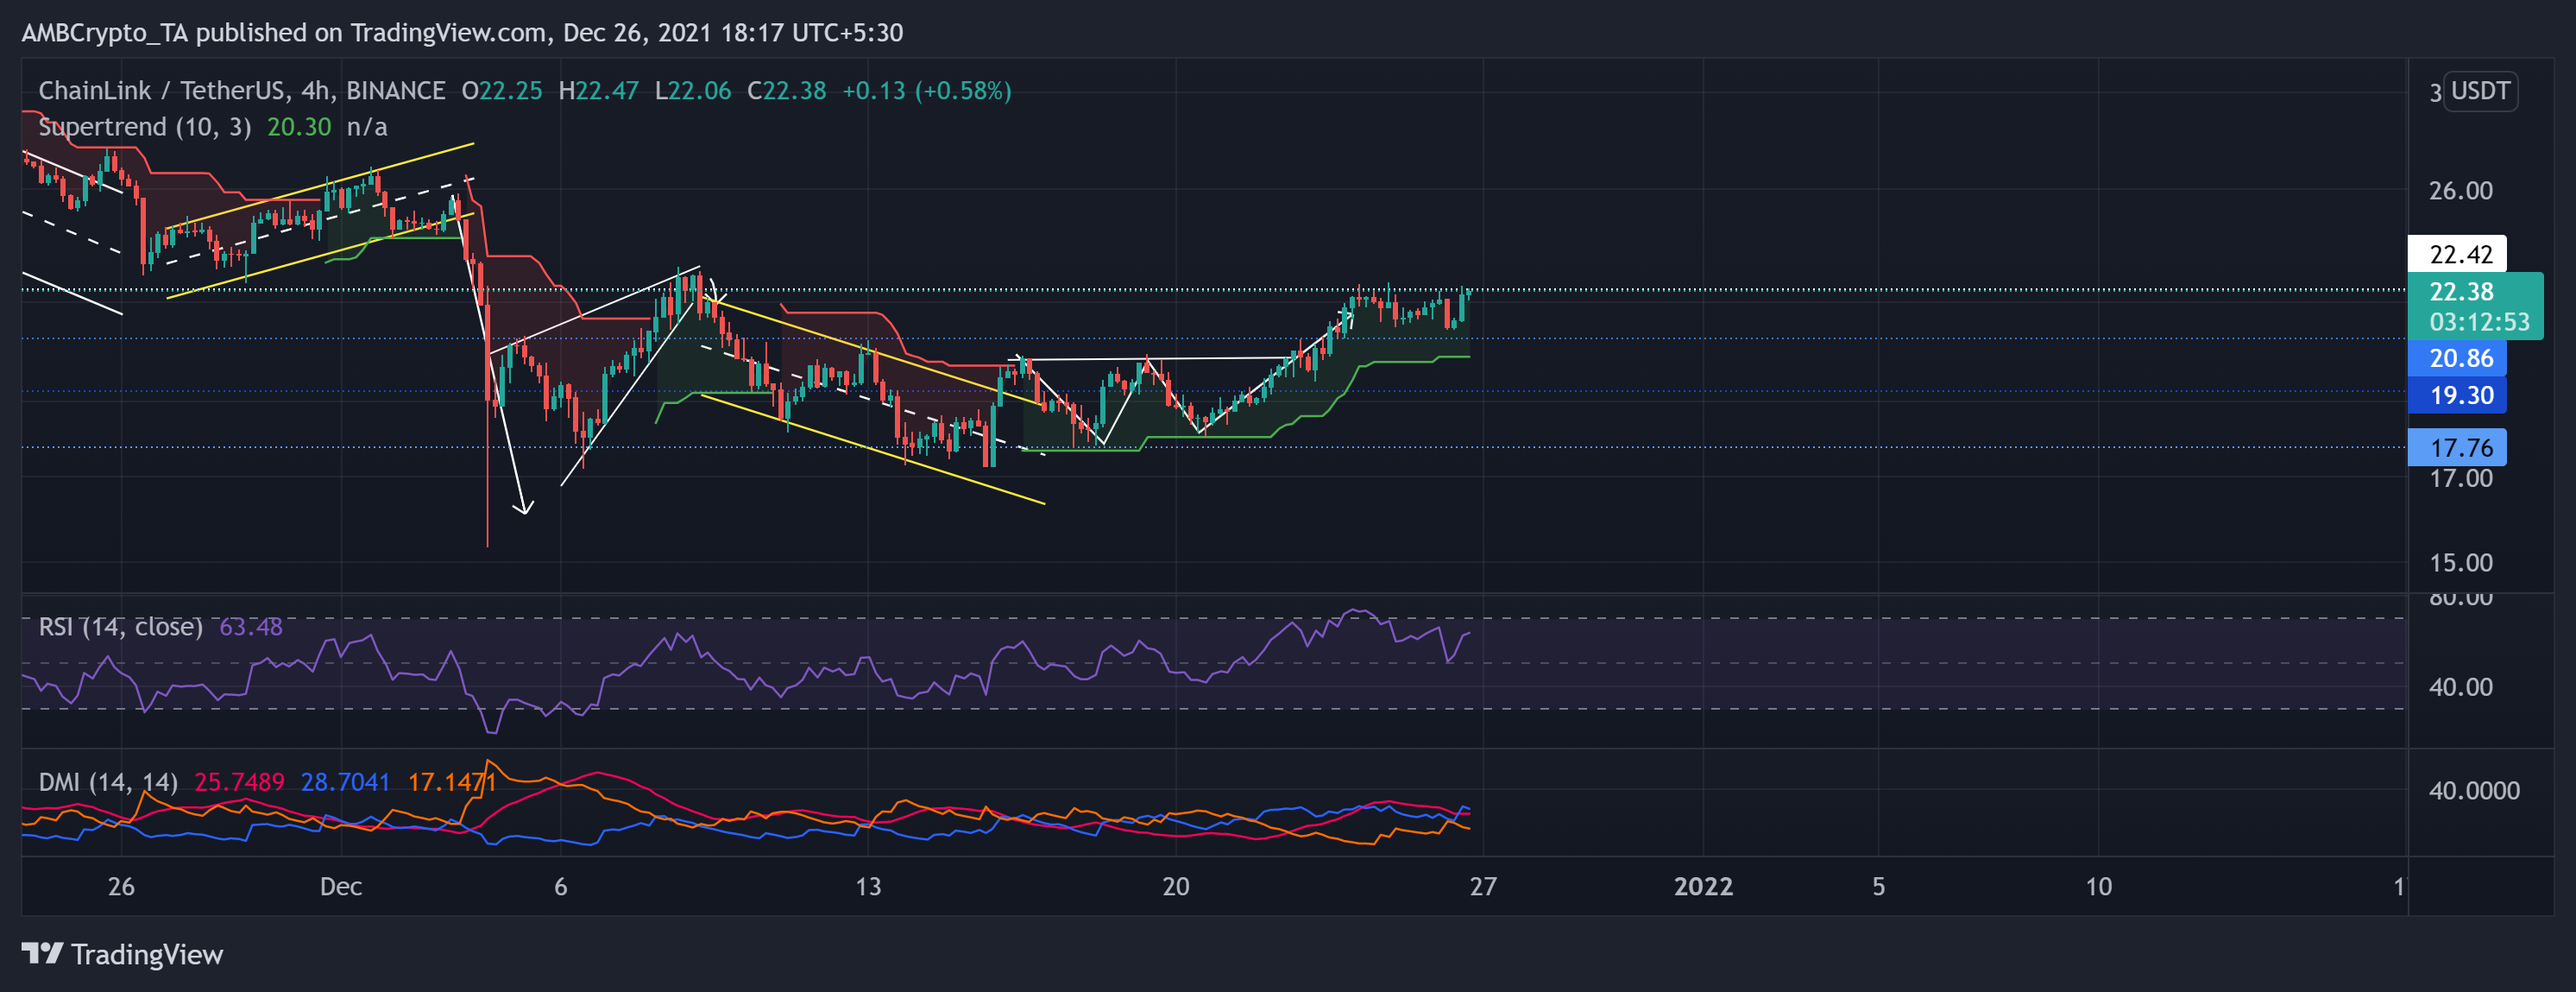
After witnessing a bearish rising wedge breakdown on 9 December, the price action transposed in a down-channel and tested the immediate support at $17.7 nearly seven times in the last 13 days. However, the altcoin marked a 29.68% incline from the 15 December low over the past 11 days.
During this phase, LINK formed a double bottom on its 4-hour chart and saw an expected breakout. Accordingly, the Supertrend continued to flash buy signals.
Now, the $22.2-level resistance stood as a testing point before any further upturn. At press time, LINK traded at $0.0. The RSI swayed near the 63-mark, hinting at a bullish preference. Also, the DMI preferred the bulls and resonated with the bullish momentum.


