With TRON trading under a crucial resistance, are new lows really on the way

Disclaimer: The findings of the following analysis are the sole opinions of the writer and should not be considered investment advice
Like Bitcoin and the rest of the market, TRON also registered a major sell-off. However, only a few altcoins have been able to project that they still have some demand behind them, despite the fear in the market. TRON was not one of them.
At the time of writing, TRON was bearish both on longer as well as shorter time frames such as the one-hour chart. The market structure was bearish as well. The $0.0559-level was a level of resistance for TRON to beat in the near term.
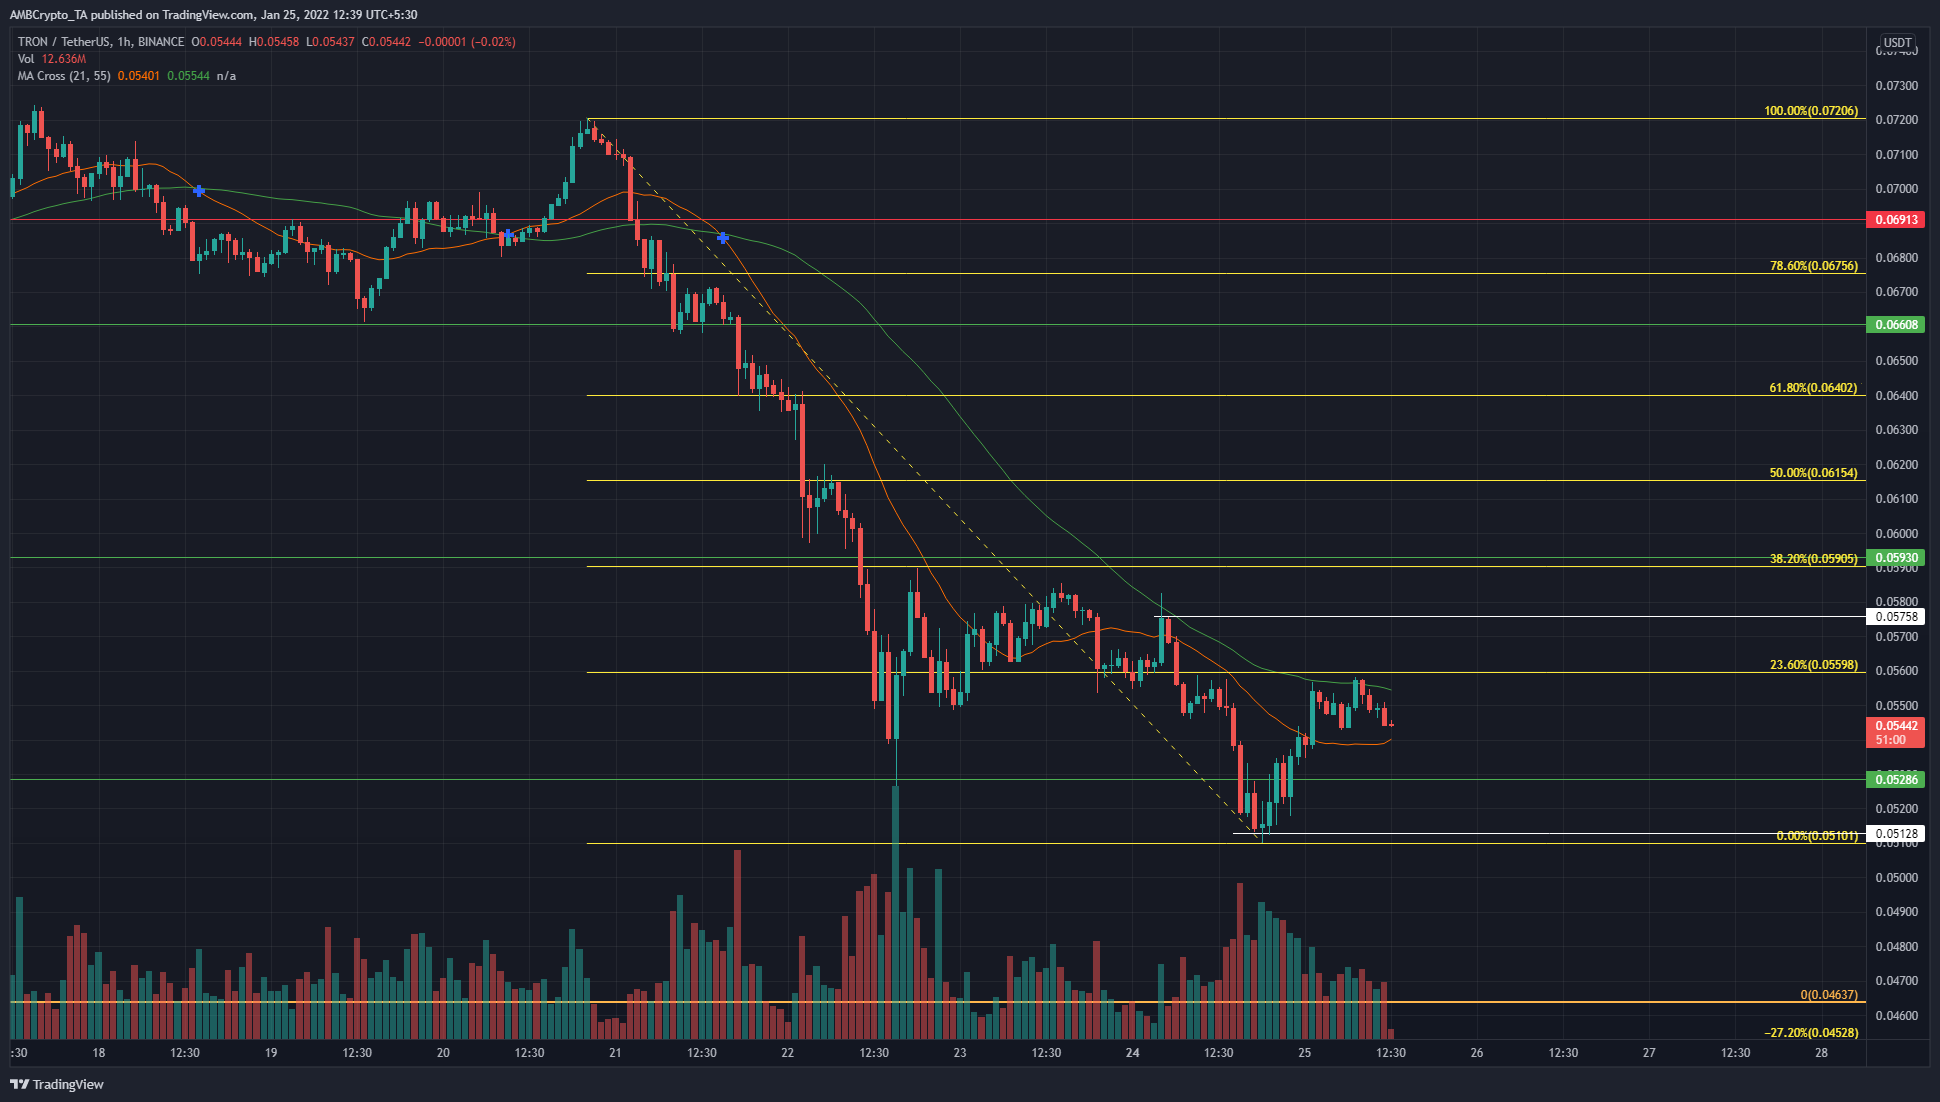
The market structure for TRON showed that the recent highs were set at $0.0575, forming a lower low at $0.051 (in white). A session close above $0.0575 followed by a successful retest as support would signal a bullish break.
Using the Fibonacci retracement tool for TRX’s move from $0.072 to $0.051, it can be seen that the $0.056-level marks the 23.6% retracement level and will likely act as resistance to the price.
While Bitcoin did bounce in the hours preceding press time, another drop cannot be ruled out. Hence, for TRX, the $0.056-area can offer opportunities to sell or enter short positions. On higher timeframes, the area from $0.048-$0.055 has acted as a demand zone. Therefore, it could be the case that TRX is set for yet another dip to $0.048-$0.051.
Rationale

On the price charts, the 21-period moving average (orange) was below the 55 SMA (green), which highlighted bearish momentum was still present.
The Awesome Oscillator was barely above the zero line – Not an indication of strong bullish momentum. A crossover back beneath the zero line can be awaited to confirm momentum has been to the downside.
The Chaikin Money Flow picked up and at the time of writing, the indicator was inconclusive with respect to the direction of capital flow. As with the AO, the CMF falling below -0.05 will be more confirmation that TRX is heading lower.
On the other hand, if the CMF continues to rise and the AO also does, the market structure and previous highs can be closely watched to see if the structure does indeed shift back in favor of bulls in the near term.
Conclusion
At the time of writing, TRX was bearish on the hourly chart and on the higher timeframe charts as well. It could be the case that the price drops toward $0.048, looking for demand. A move above $0.0575 could signal a shift in bias for TRX.