Ethereum, Uniswap, IOTA Price Analysis: 09 February

The past two weeks showcased a sizeable bullish recovery attempt after the bears pushed the prices to their multi-month lows on 24 January. Thus, Ethereum and IOTA continued their up-channel trajectories while jabbing through crucial support levels. On the flip side, Uniswap saw a rectangle breakout as the bears tried to defend the $12.5-area.
Ether (ETH)
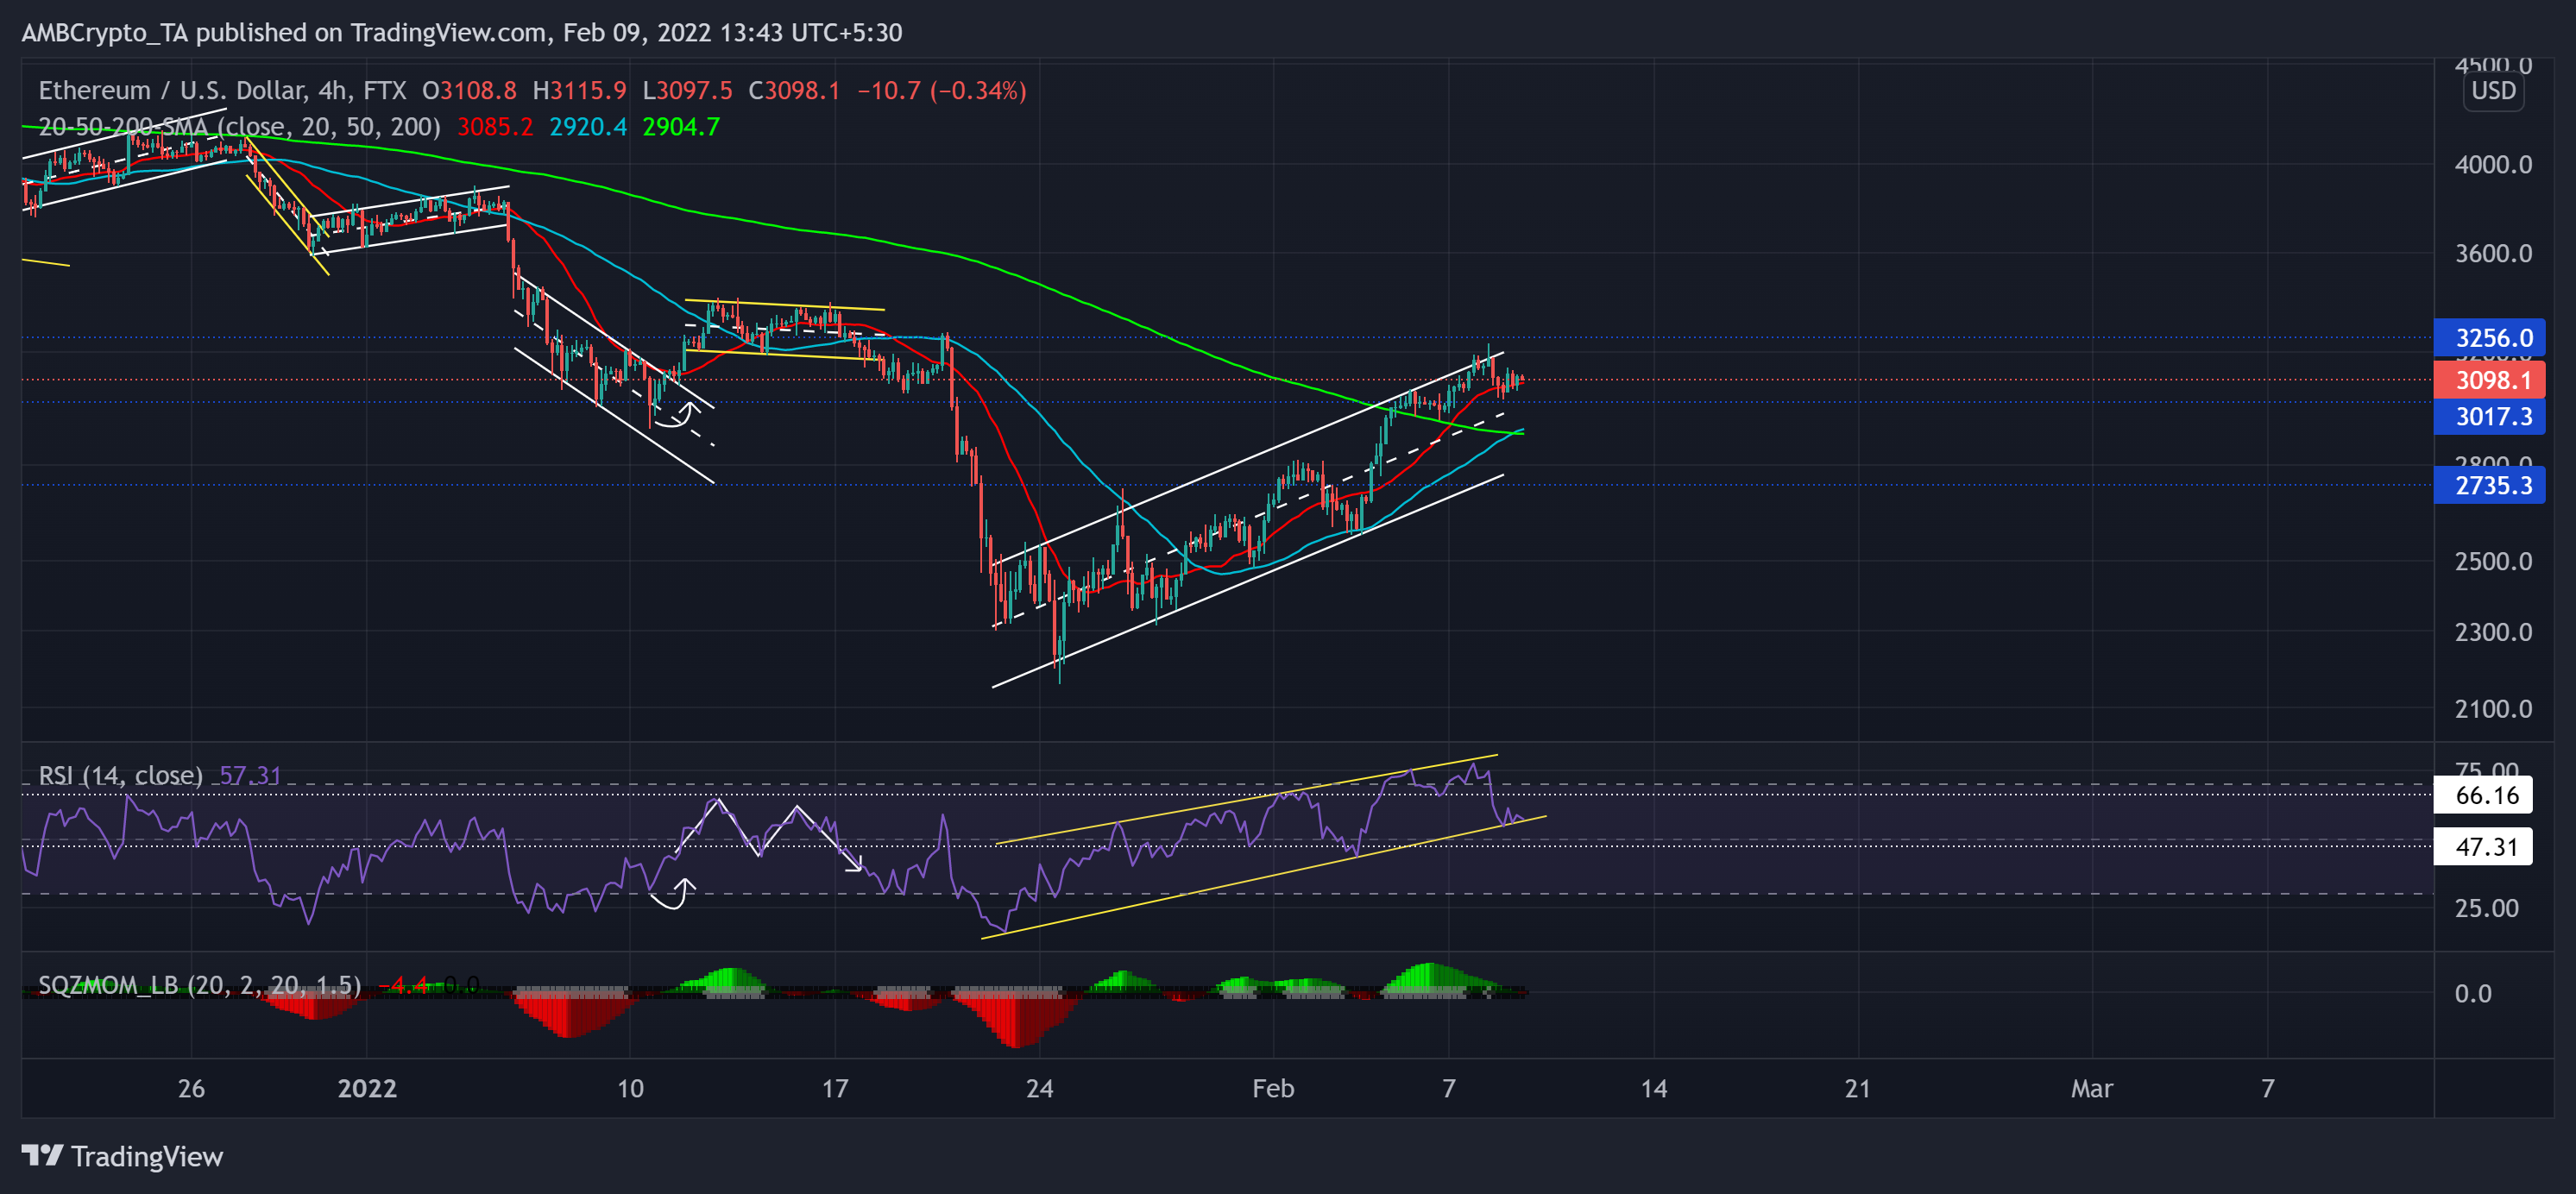
Since falling below the $4,000-mark, ETH bears initiated substantial sell-offs. As a result, ETH registered a 46.81% loss (from 27 December high) and touched its six-month low on 24 January.
Since then, however, it saw a 43.2% ROI in just the last 15 days while snapping off multiple supports (previous resistance). As a result, the alt marked an ascending channel (white) and reclaimed the $3000-support. Further, the 20 SMA (red) and the 50 SMA (cyan) moved above the 200 SMA, reaffirming the increased bullish edge. From here on, immediate resistance stood at the $3,200-level while the $3000-support stood strong.
At press time, ETH traded at $3,098.1. The bullish RSI undertook a steep recovery in an up-channel (yellow). After swaying in the overbought region for four days, it plunged to test the lower trendline on 9 February. This reading hinted at a bullish bias. Besides, the Squeeze Momentum Indicator pointed at a low volatility phase in the near term.
Uniswap (UNI)
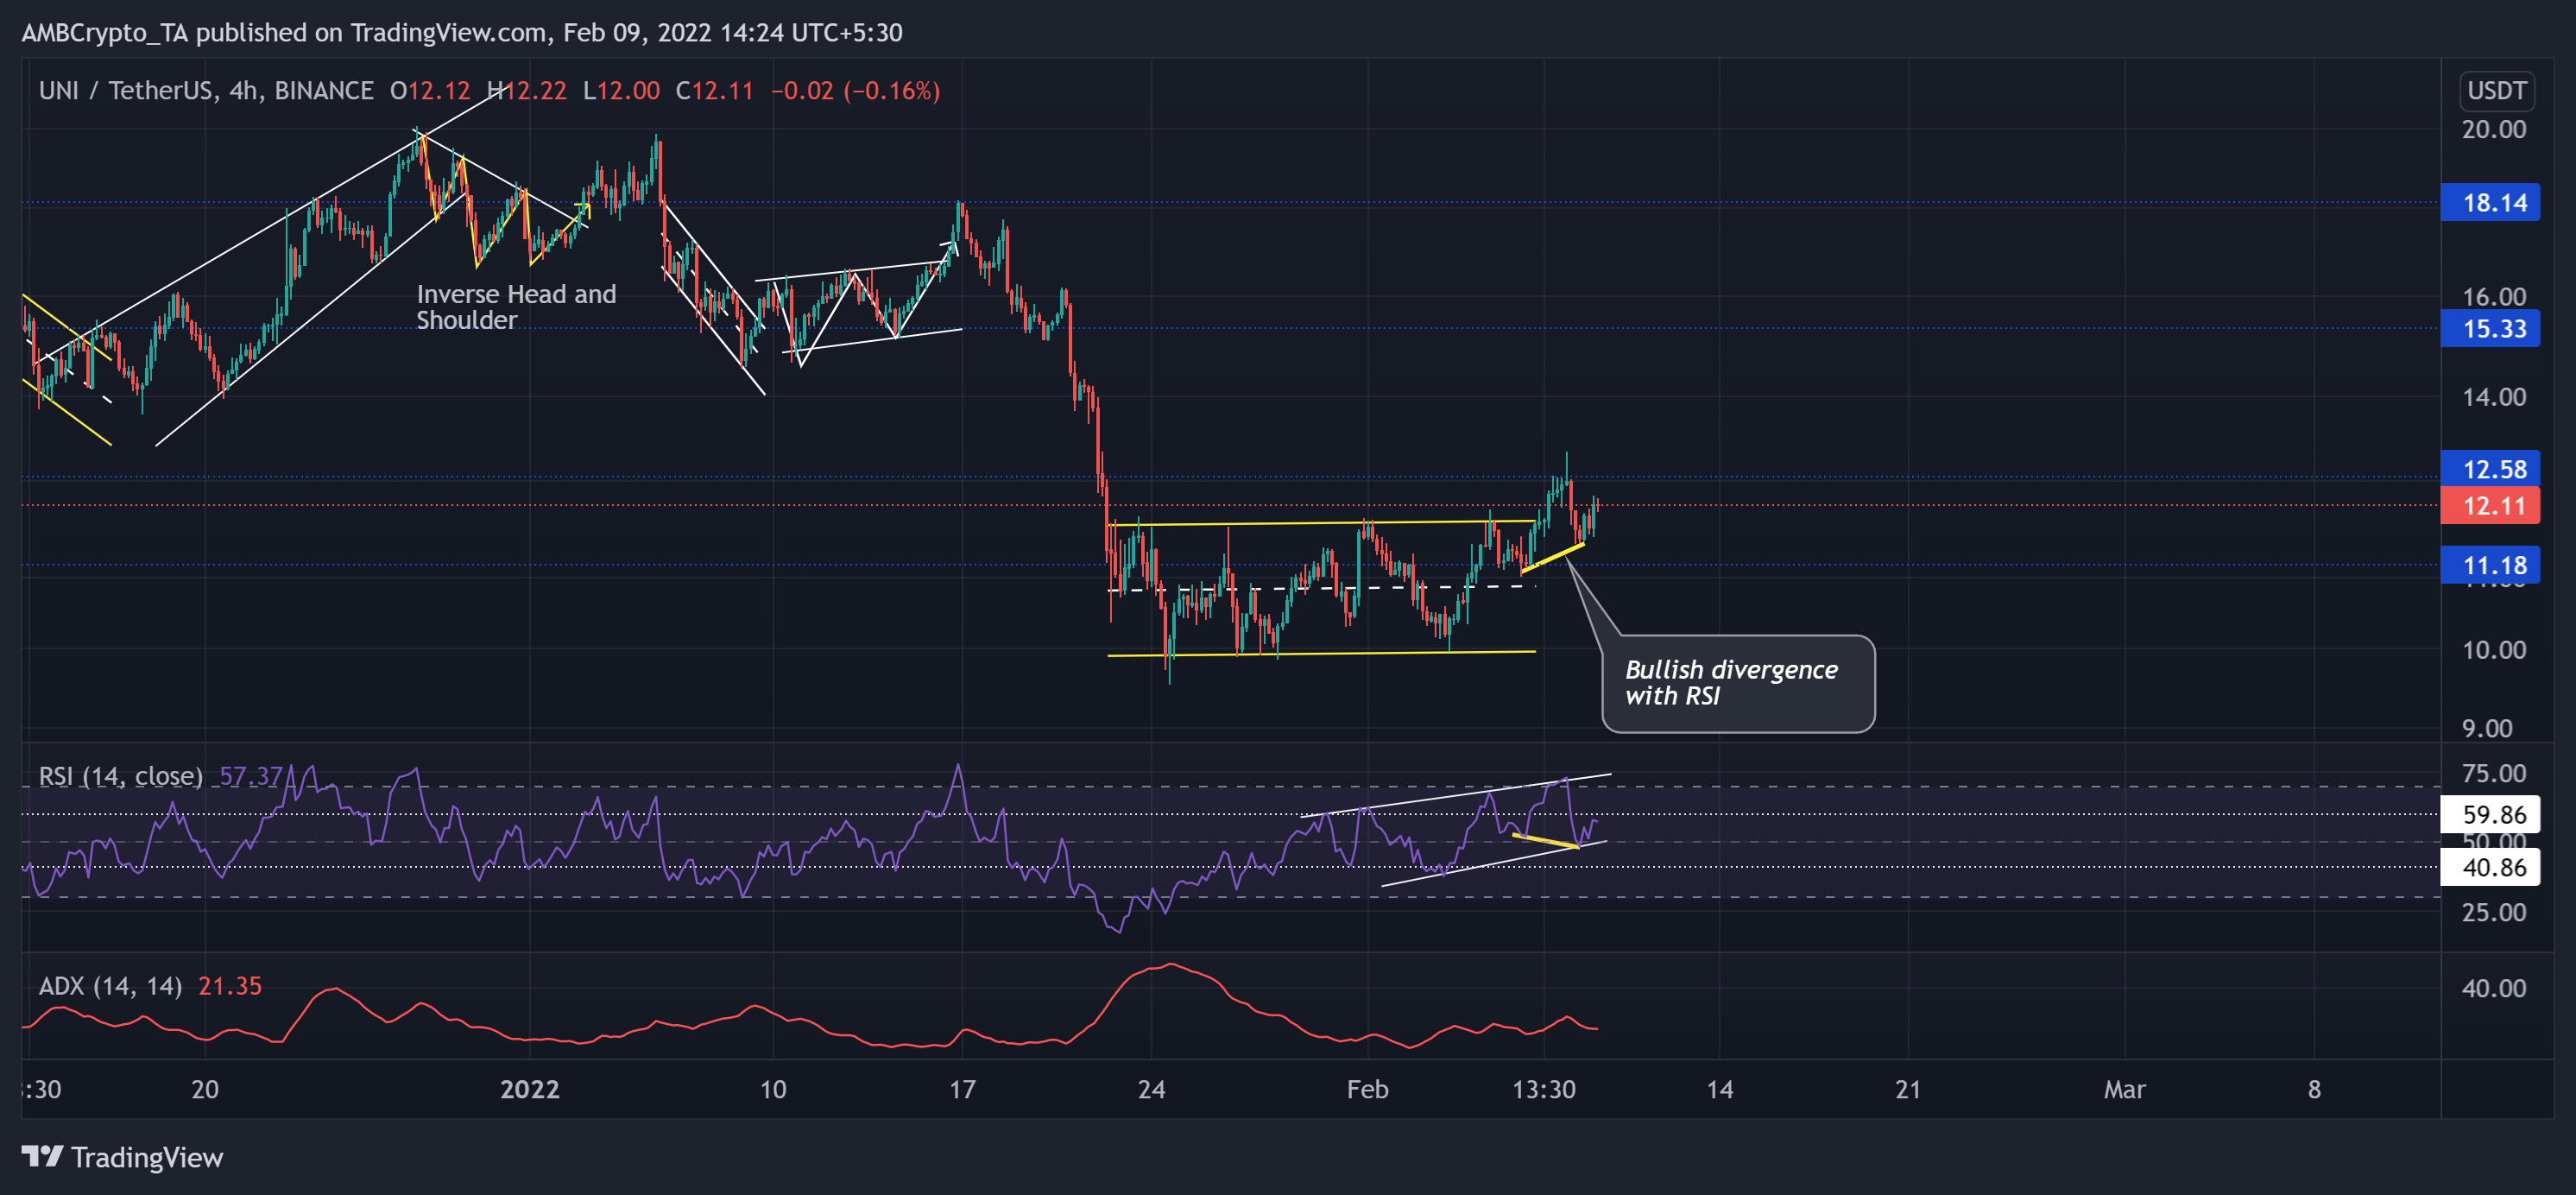
Ever since reversing from the $18.14-mark, UNI bulls have not been able to propel a sustained close above the $12.5-zone. The alt noted a 47.51% fall (from 17 January) and touched its one-year low on 24 January.
Since then, UNI moved in a rectangle (yellow) between two horizontal trendlines until a breakout on 7 February. However, the bears still upheld the $12.5-mark (immediate resistance). Any retracements would continue to see support at the $11.18-level.
At press time, the alt traded at $12.11. Since crossing the 40-mark, the RSI managed to see impressive gains that helped it sustain a close above the half-line. Also, UNI saw an over 14% two-day gain after a bullish divergence (yellow trendline) with its RSI. However, the ADX depicted a weak directional trend for the alt.
IOTA
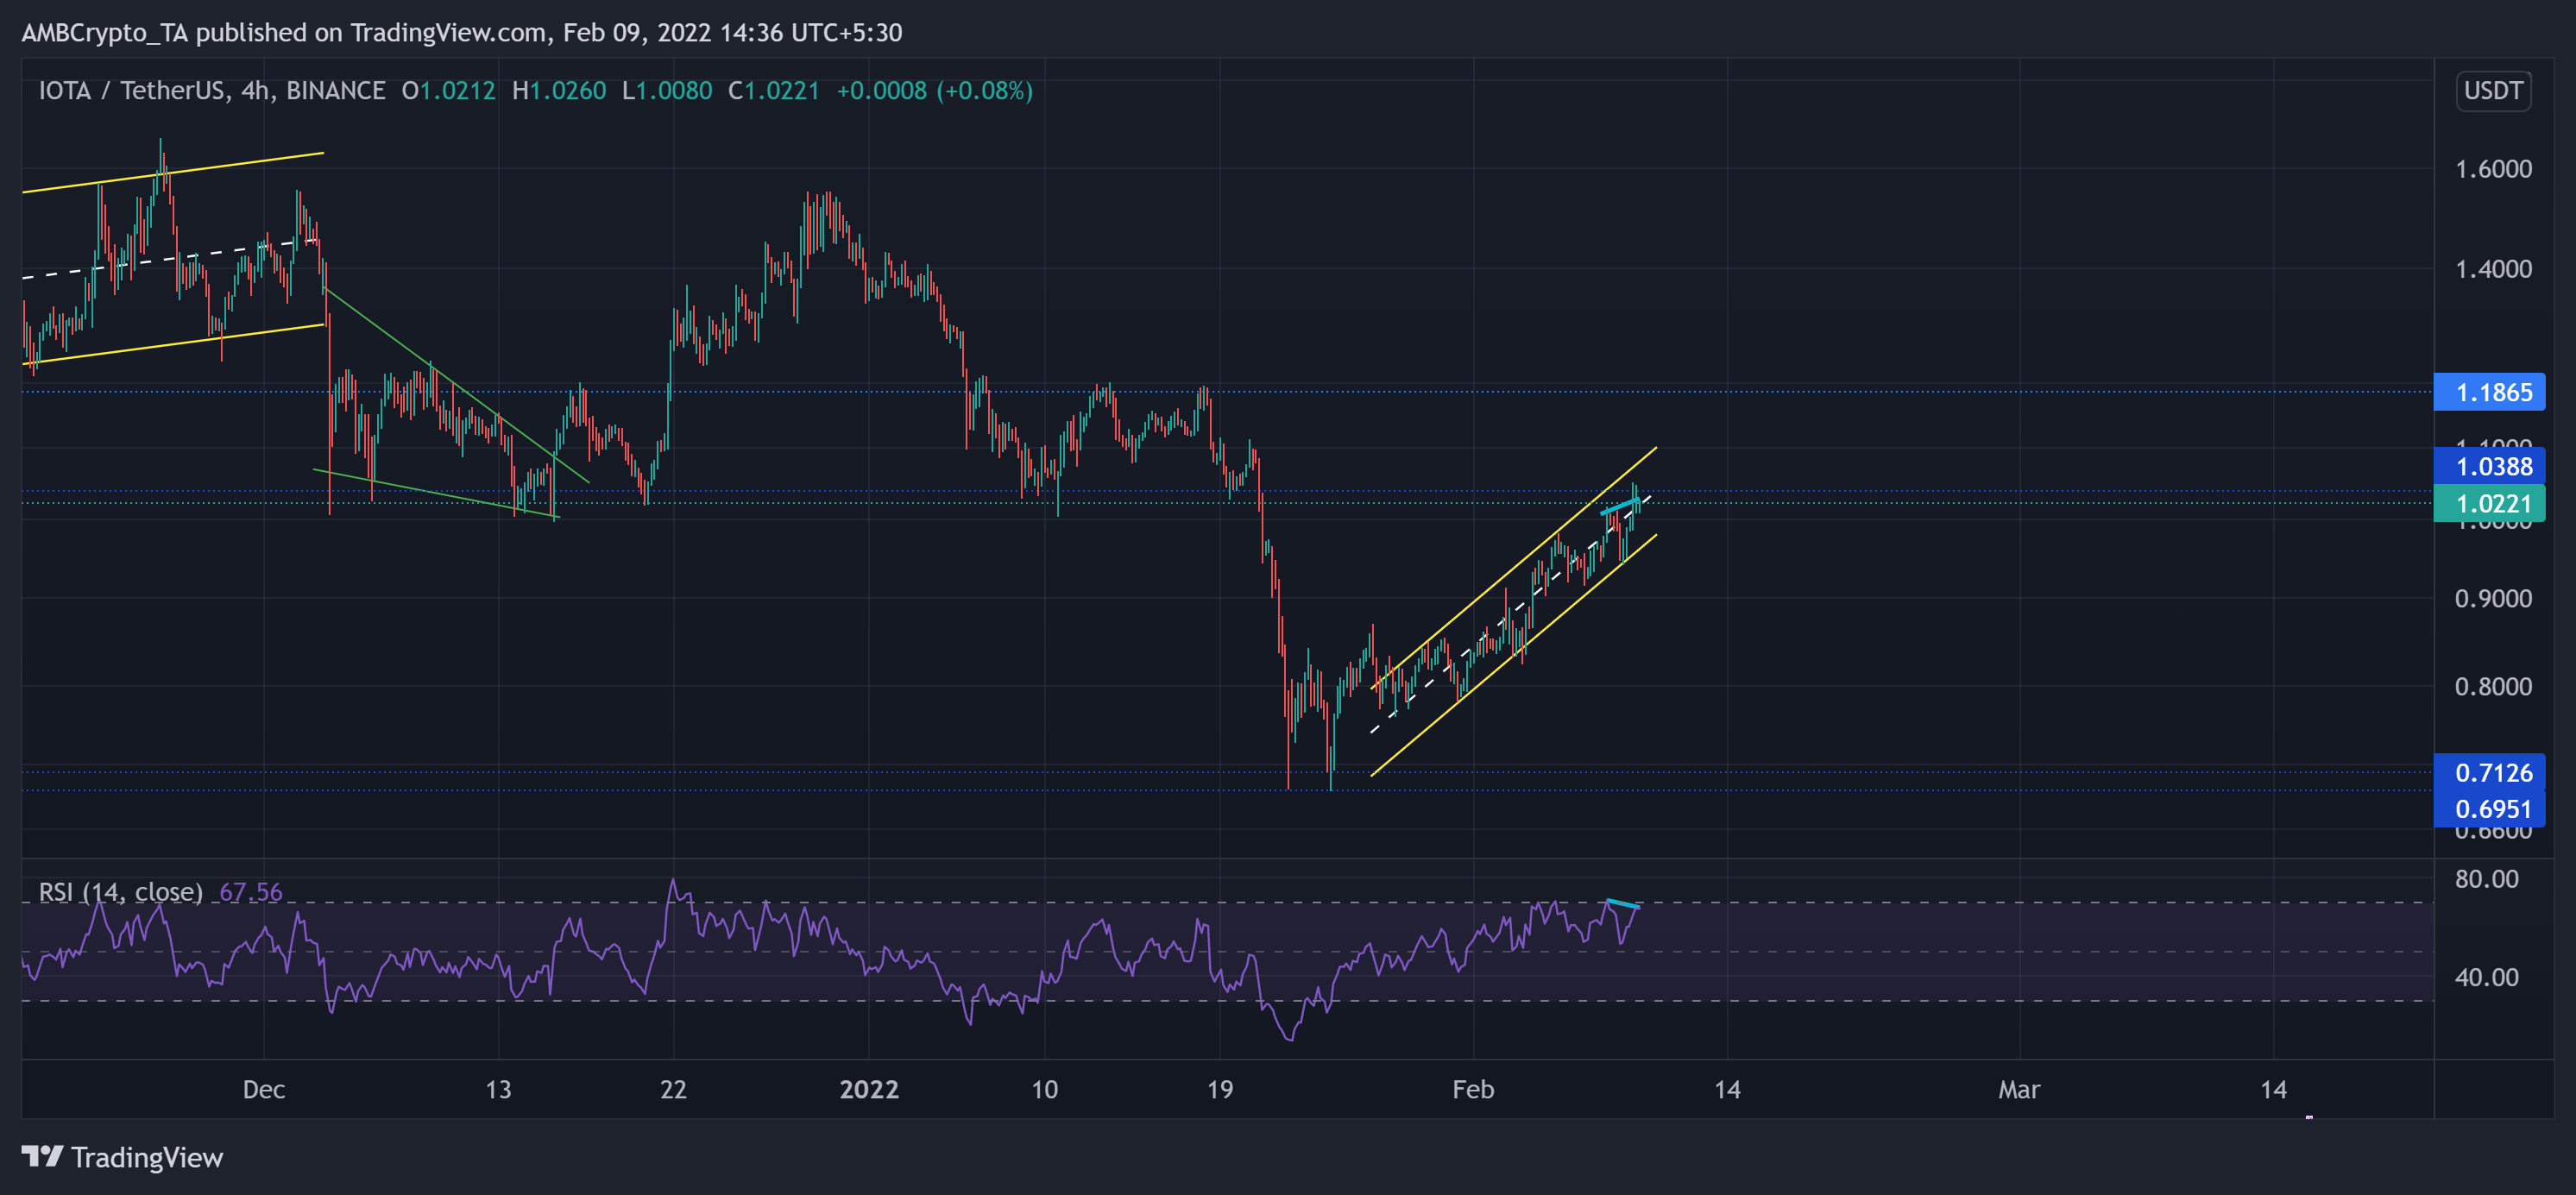
IOTA saw a substantial up-channel breakdown on 20 January and marked a 37% retracement towards its six-month low on 24 January. Consequently, the bears flipped the vital $1.03-mark from support to immediate resistance.
But the bulls failed to dwindle as they initiated an up-channel (yellow) rally that fetched nearly 48% gains in the last 16 days.
At press time, IOTA traded at $1.0221. The near-term technical indications hinted at slightly decreasing buying influence. The RSI chose the bulls by moving near the overbought region. But it formed a bearish divergence with the price as it showed some slowing signs.