Polkadot back at an area of supply – can it climb above or is a rejection in store

Disclaimer: The findings of the following analysis are the sole opinions of the writer and should not be considered investment advice
Polkadot has been in a strong downtrend since mid-November. Throughout December, the $23 area was tested multiple times to find demand before it finally succumbed to the selling pressure. Even though Polkadot is regarded positively by developers due to its scalability, on the charts, DOT has been taking a beating. A recent report highlighted how Polkadot’s carbon emissions were on the lower side of the spectrum. Can the price of DOT push past bearish barriers?
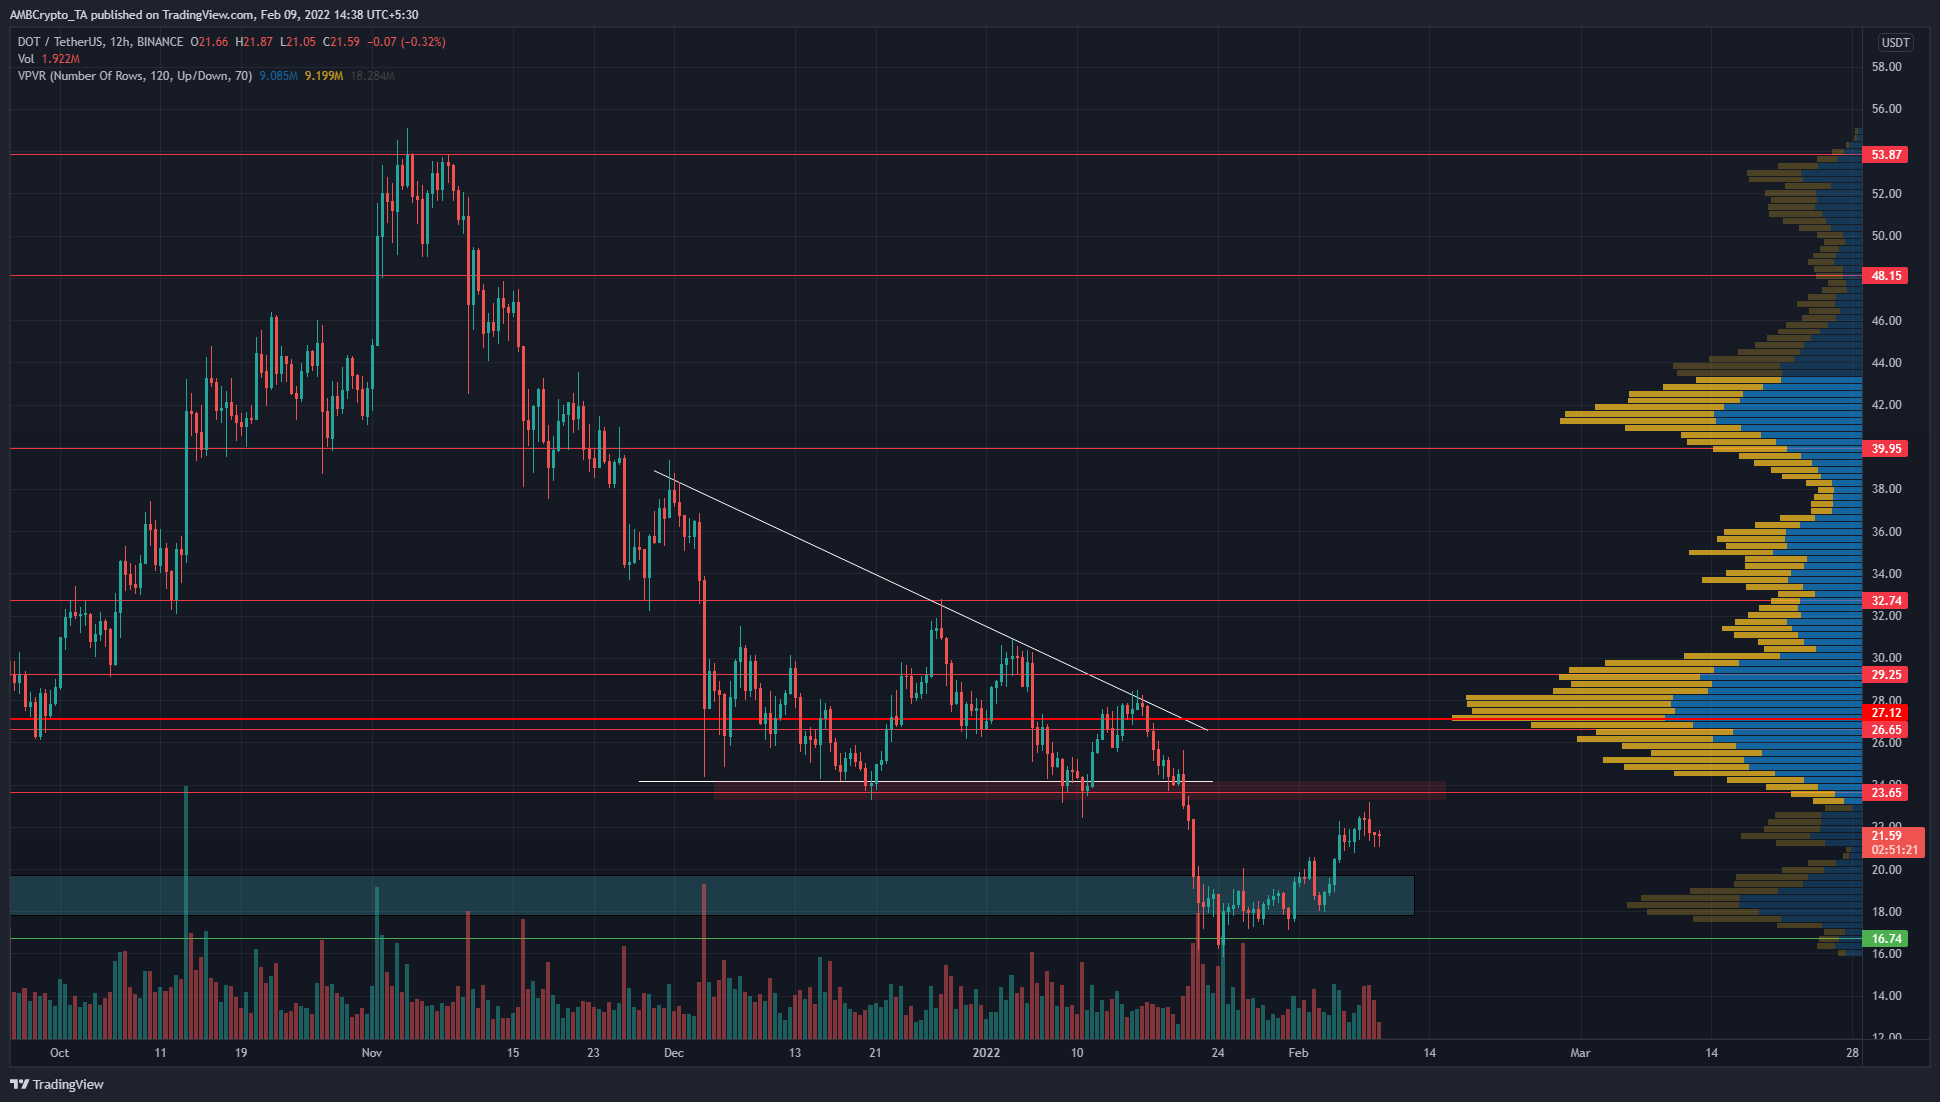
The price formed a descending triangle in December (white) and, as already highlighted, visited the $23 area multiple times in search of demand. In the sell-off event three weeks into January, DOT saw a sharp decline to the $16 area.
In the past two weeks, the price has recovered somewhat and has once more approached the $23 area, but found strong sellers.
The long-term trend remained bearish- the previous lows still offered significant resistance. A move above the $23 level would be necessary before a shift in the longer-term direction can be considered.
Volume Profile Visible showed that the Point of Control lay at $27.12, with the whole region from $24 to $30 being an area where DOT has traded within for an entire month. Hence, the way upward would also likely be paved with resistance to the price movement.
Rationale

The 12-hour RSI reflected the bearish bias behind DOT in the past two months. It has been below neutral 50 for the most part of the past two months, although in the past week the RSI climbed back above neutral 50. The Cumulative Delta Volume has also been in a downtrend since November, although the past few weeks have seen some demand.
The MACD was also a similar story- it had been laboring beneath the zero line as wave after wave of selling rocked DOT, but in the past few days, it has hauled itself back above the zero line.
Conclusion
The indicators showed that the past couple of weeks has seen some demand step in alongside a shift in momentum toward bullish. The market structure remained bearish for the longer term but had been flipped bullish for a near-term bias. Taken together, long-term investors would like to see DOT climb past the $24 area and retest it as support. Even then, significant resistance can be expected all the way up to $30.


