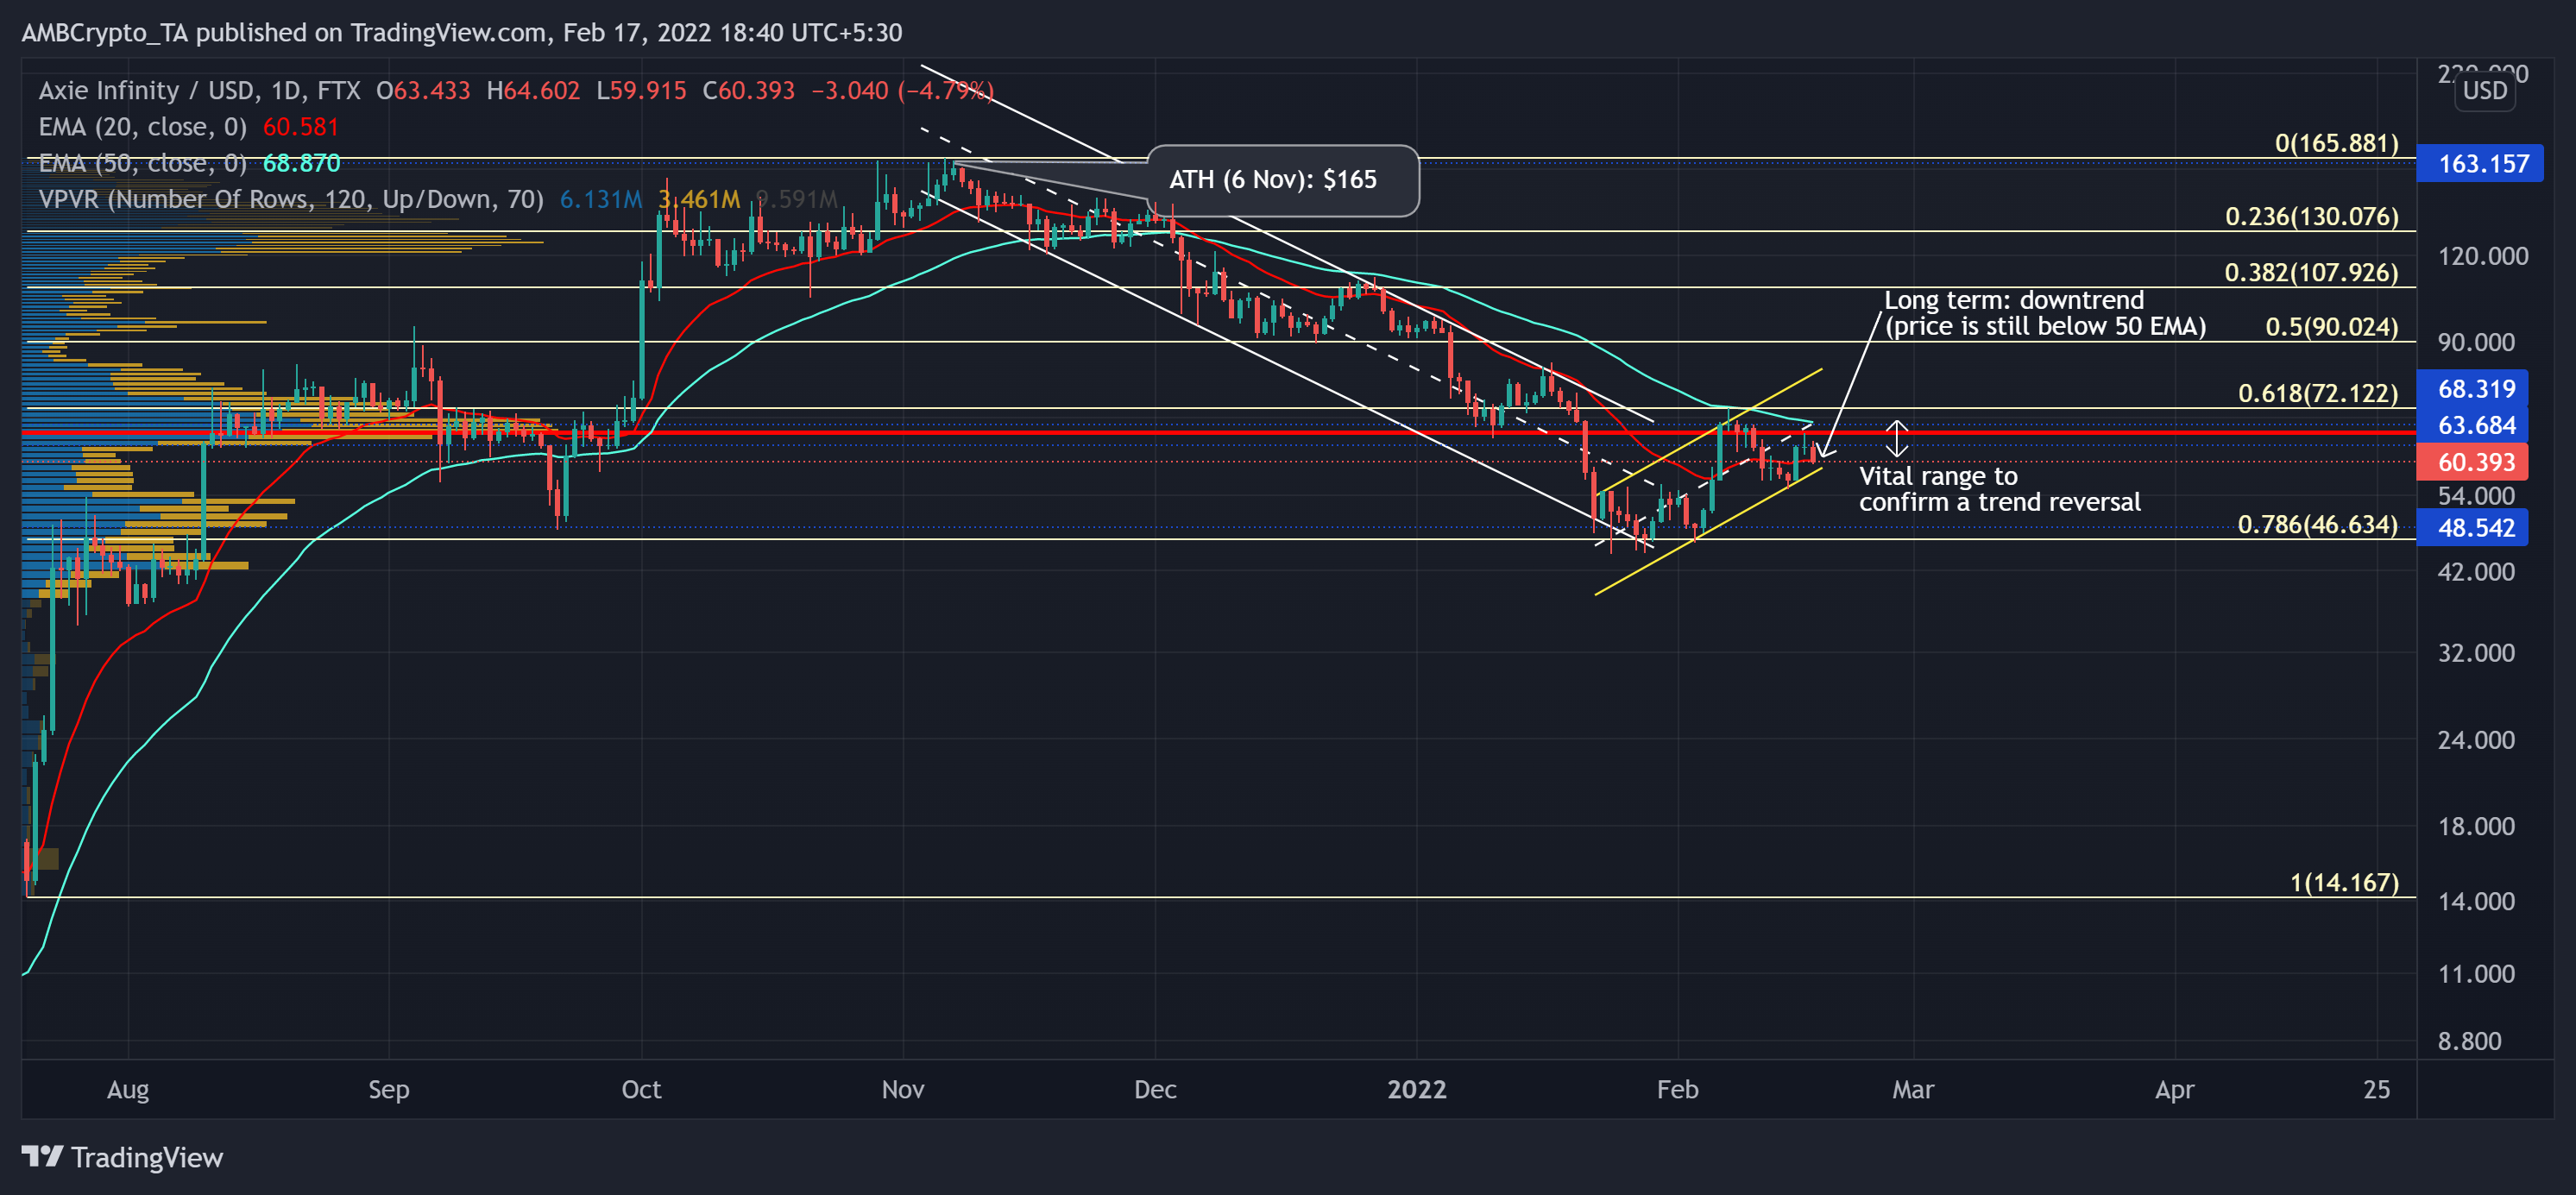
This is a crucial range to determine Axie Infinity’s trend in near-term

Since attaining its ATH on 6 November, Axie Infinity (AXS) commenced its downtrend and parallelly declined while piercing through the vital price points.
From here on, any close below the 20 EMA would reaffirm the bearish control and lead AXS to possibly test the lower trendline of its up-channel (yellow) followed by the six-month support at the $48-zone. At press time, AXS traded at $59.49, down by 4.64% in the last 24 hours.
AXS Daily Chart
The latest bearish phase marked a descending channel (white) on its daily chart as the alt lost nearly 72% (since 6 November) and poked its five-month low on 24 January. As a result, the 20 EMA (red) stood as a strong resistance while it fell below the 50 EMA (cyan).
Due to this trajectory, AXS lost the vital 61.8% Fibonacci level and the crucial Point of Control (red) near the $66-mark. The fall halted at the 78.6% Fibonacci level. The buyers have upheld this level for over six months now.
Moving ahead, the buyers did step in at the $48-support and propelled over 40% gains, but they struggled to topple the Point of Control. Any close below the 20 EMA would confirm an Evening star (bearish) candlestick pattern and heighten the chances of a continued downtrend. Also, the price needed to close above 50 EMA and reclaim its 61.8% level to confirm a healthy reversal.
Rationale
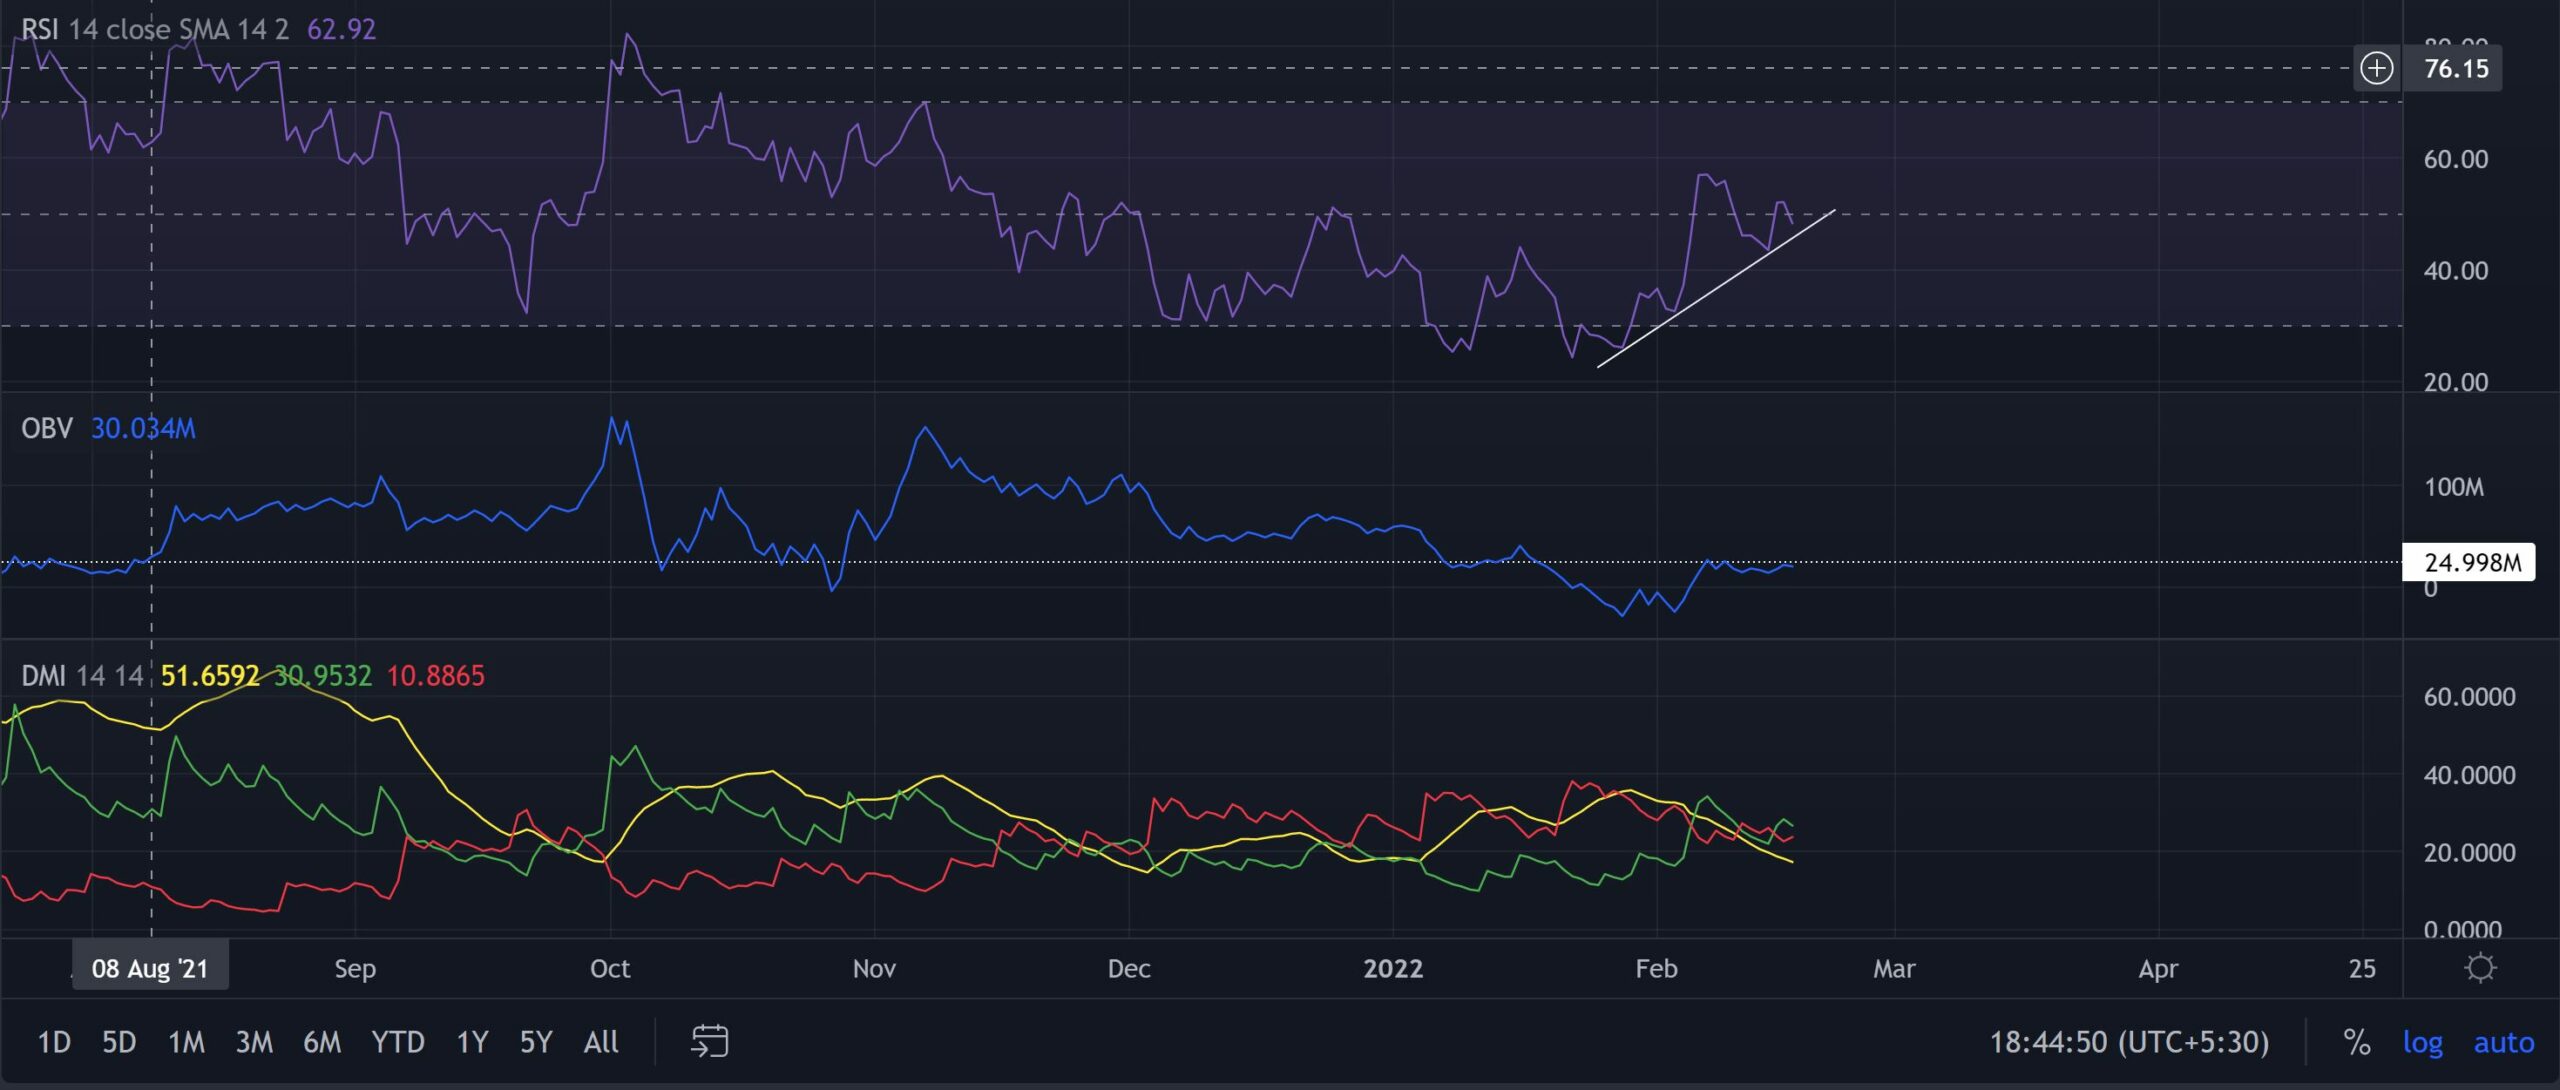
The RSI corresponded with the recent uptrend and tested the half-line multiple times in the ten days. If it ensures its trendline support, a close above the half-line would be likely. But the OBV still needed to overturn its resistance to confirm the buying pressure. Also, the DMI hinted at a possible bearish crossover, but the ADX was substantially weak.
These readings meant that the bulls still could not ramp up their volumes to find a jump above the Point of Control and the golden Fibonacci level.
Conclusion
AXS now walked on thin ice. The $63-$68 range is crucial to confirm either a healthy reversal or a likely continuation of its downtrend. To top it up, the alt shared a 79% 30-day correlation with Bitcoin. Hence, keeping an eye on Bitcoin’s movement along with the overall market sentiment would be essential to make a profitable move.
Disclaimer: The findings of the following analysis are the sole opinions of the writer and should not be considered investment advice.


