WAVES: Assessing if this support level will hold after retests

Disclaimer: The findings of this analysis are the sole opinions of the writer and should not be considered investment advice
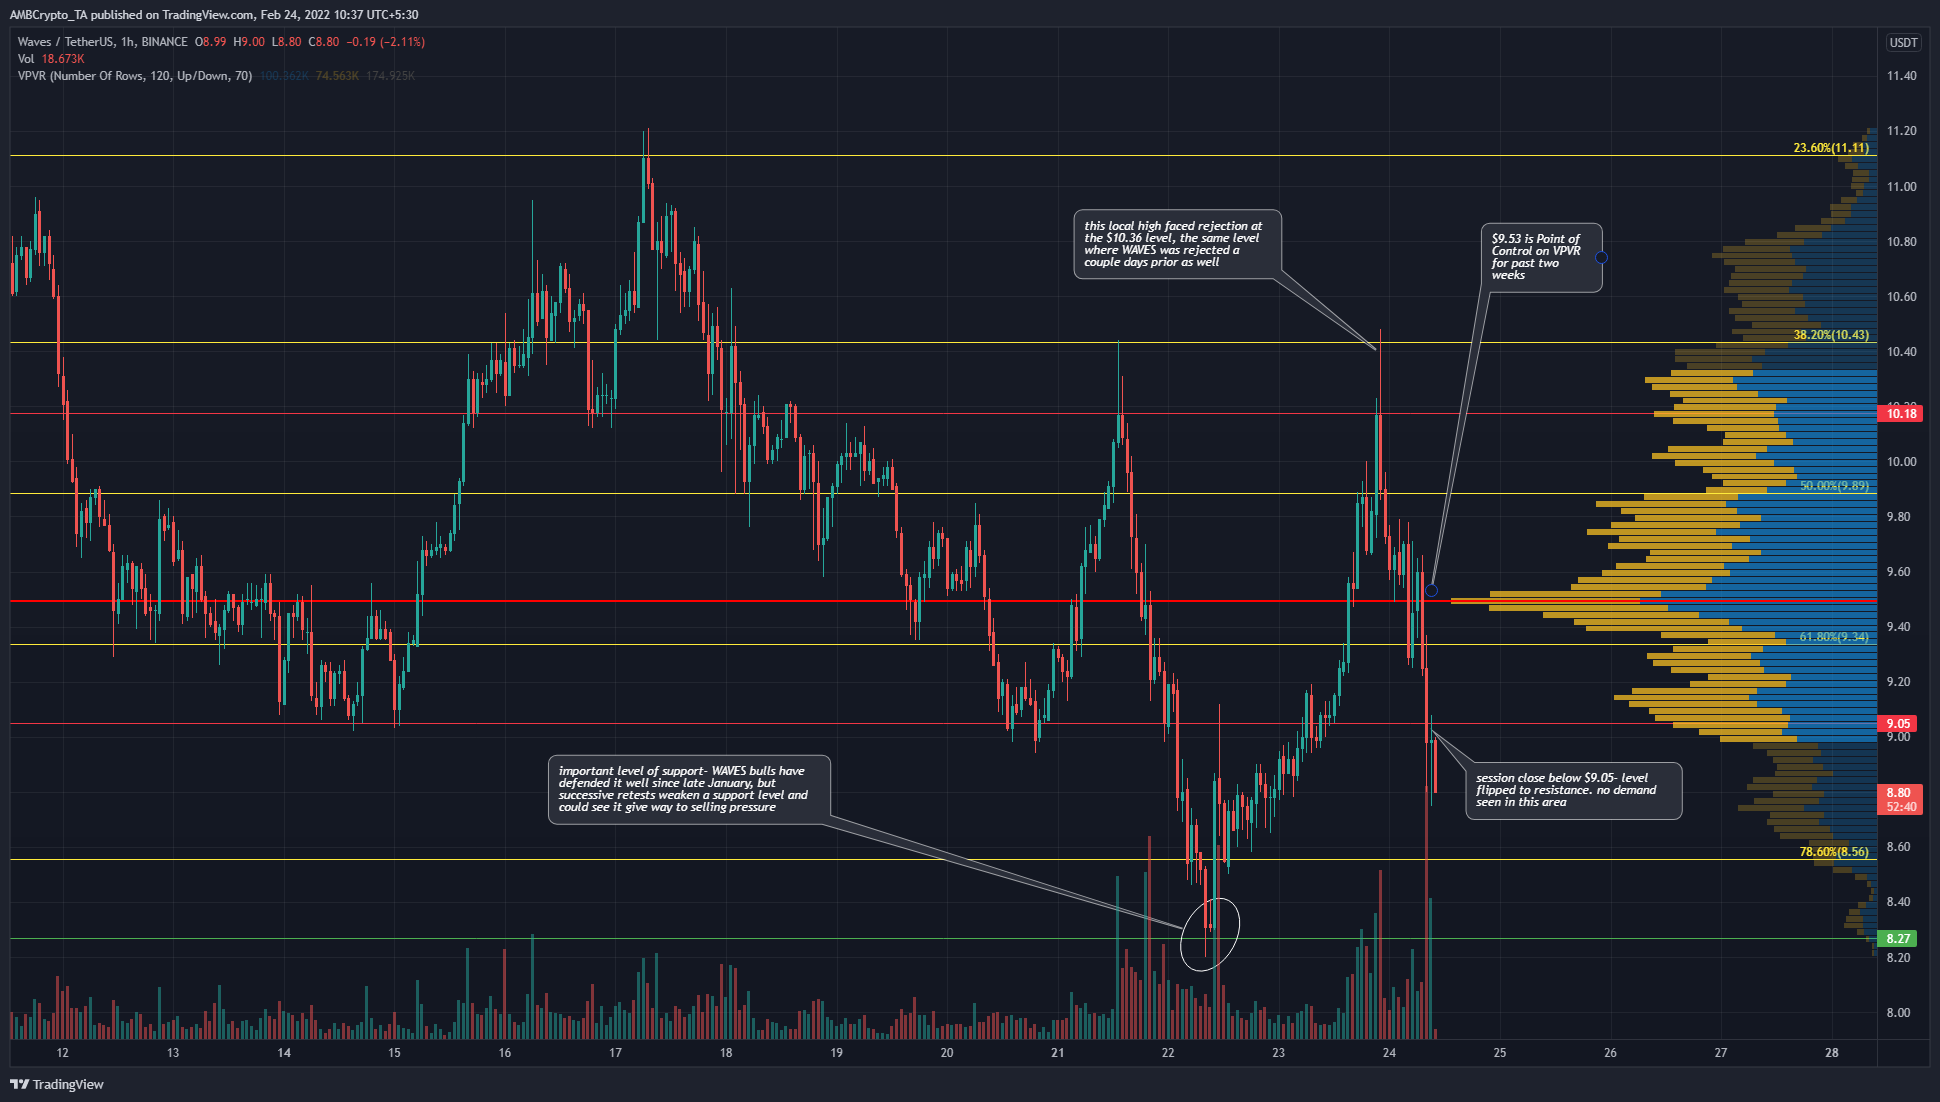
Bitcoin faced rejection at the $39k resistance level and fell 11% in a matter of hours. WAVES followed the same path and also saw losses of 15%. However, it was climbing at the time of writing after sellers showed their strength at the $10.4 level. It remains to be seen whether the fear in the markets will drive WAVES below the month-long support at $8.27.
WAVES- 1H
In early February, WAVES moved up the charts from $7.56 to $12.21. Based on this move, a set of Fibonacci retracement levels (yellow) were plotted. This gave the 61.8% and 78.6% retracement levels at $9.34 and $8.56. And, at the time of writing, the price dropped decisively below $9.34.
Moreover, the $9.05 level also appeared to have been flipped into resistance. There was a possibility that the $8.27 and $10.43 levels from the range lows and highs can see strong moves in the days to come. There simply wasn’t enough buying pressure on WAVES’ move up. It was more likely that Bitcoin, and WAVES’ move upward in the previous day, was in search of liquidity for the move down and not fueled by genuine demand.
The Volume Profile Visible Range showed that the Point of Control for the past two weeks stood at $9.53, and at the time of writing, the price was beneath the Value Area Lows as well.
Rationale
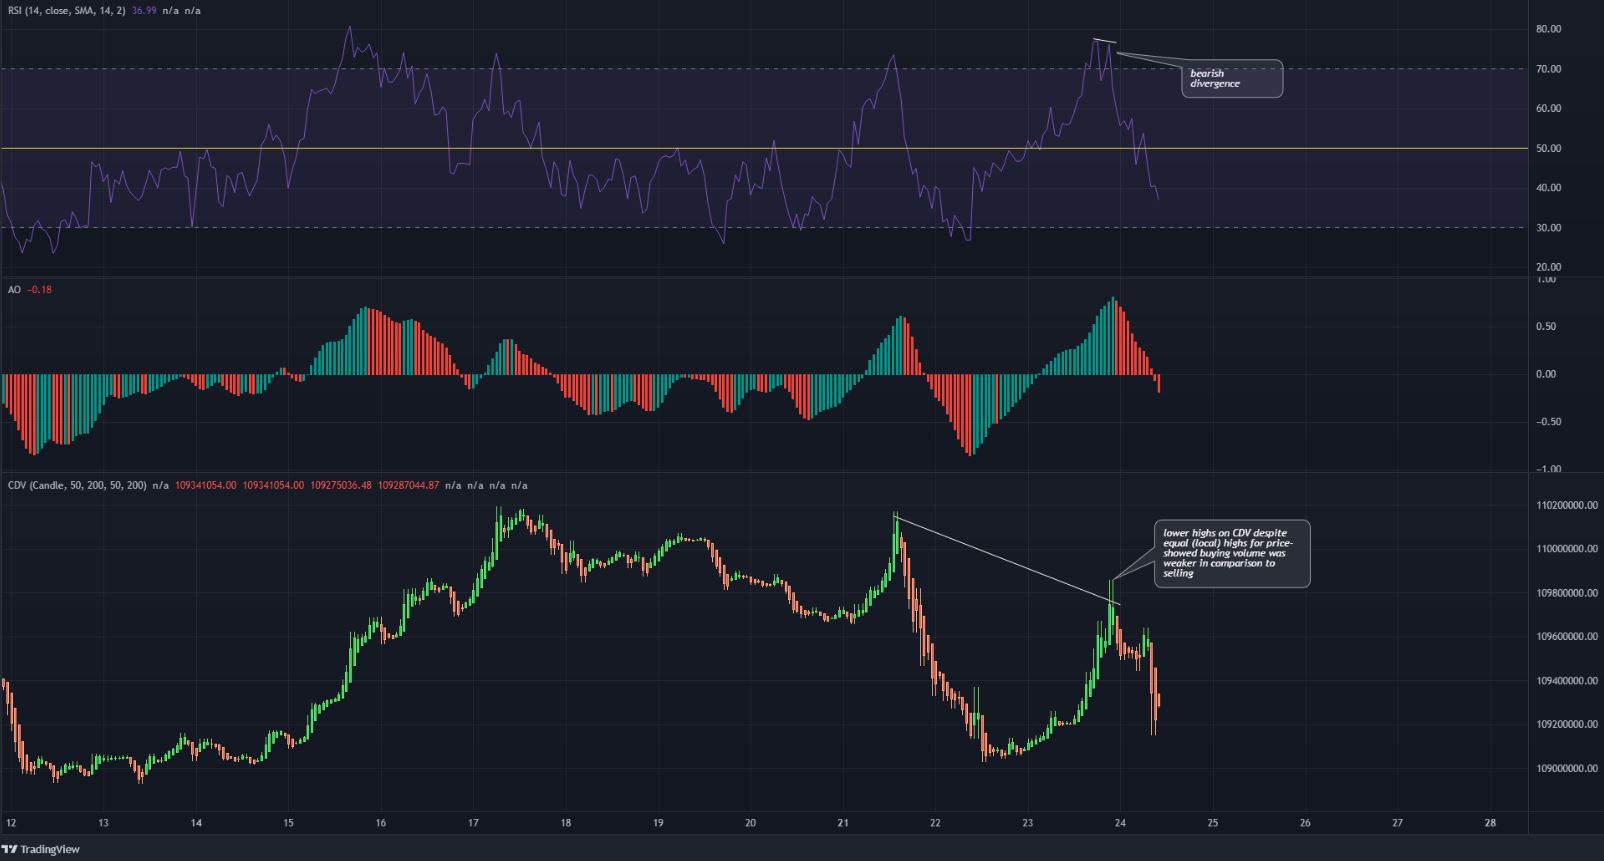
The indicators showed rising bearish momentum in recent hours- the RSI showed a bearish divergence as it made a lower high while the price made a higher high at $10.2. This divergence, combined with Bitcoin’s drop, saw WAVES plunge lower.
The Awesome Oscillator has also dived beneath the zero line. The CDV formed a lower high in the past few days, even though the price pushed toward the same highs at $10.2. This showed that buying volume has been much weaker than the selling volume.
Conclusion
The lack of genuine demand was understandable given market conditions, and further downside appeared likely. The $8.27 support level has stood strong since January, but repeated retests would likely have weakened it. Therefore, a move towards $8.27 can be seen in the next few days.


![Kusama [KSM] explodes 119% in one day - How DOT helped](https://ambcrypto.com/wp-content/uploads/2024/11/Michael-KSM-400x240.webp)


