How this divergence could affect NEAR’s short term price action

Since its January highs, the bears had assumed control until NEAR plunged towards its $7.6-base. Since then, the alt has been on a gradual but consistent recovery.
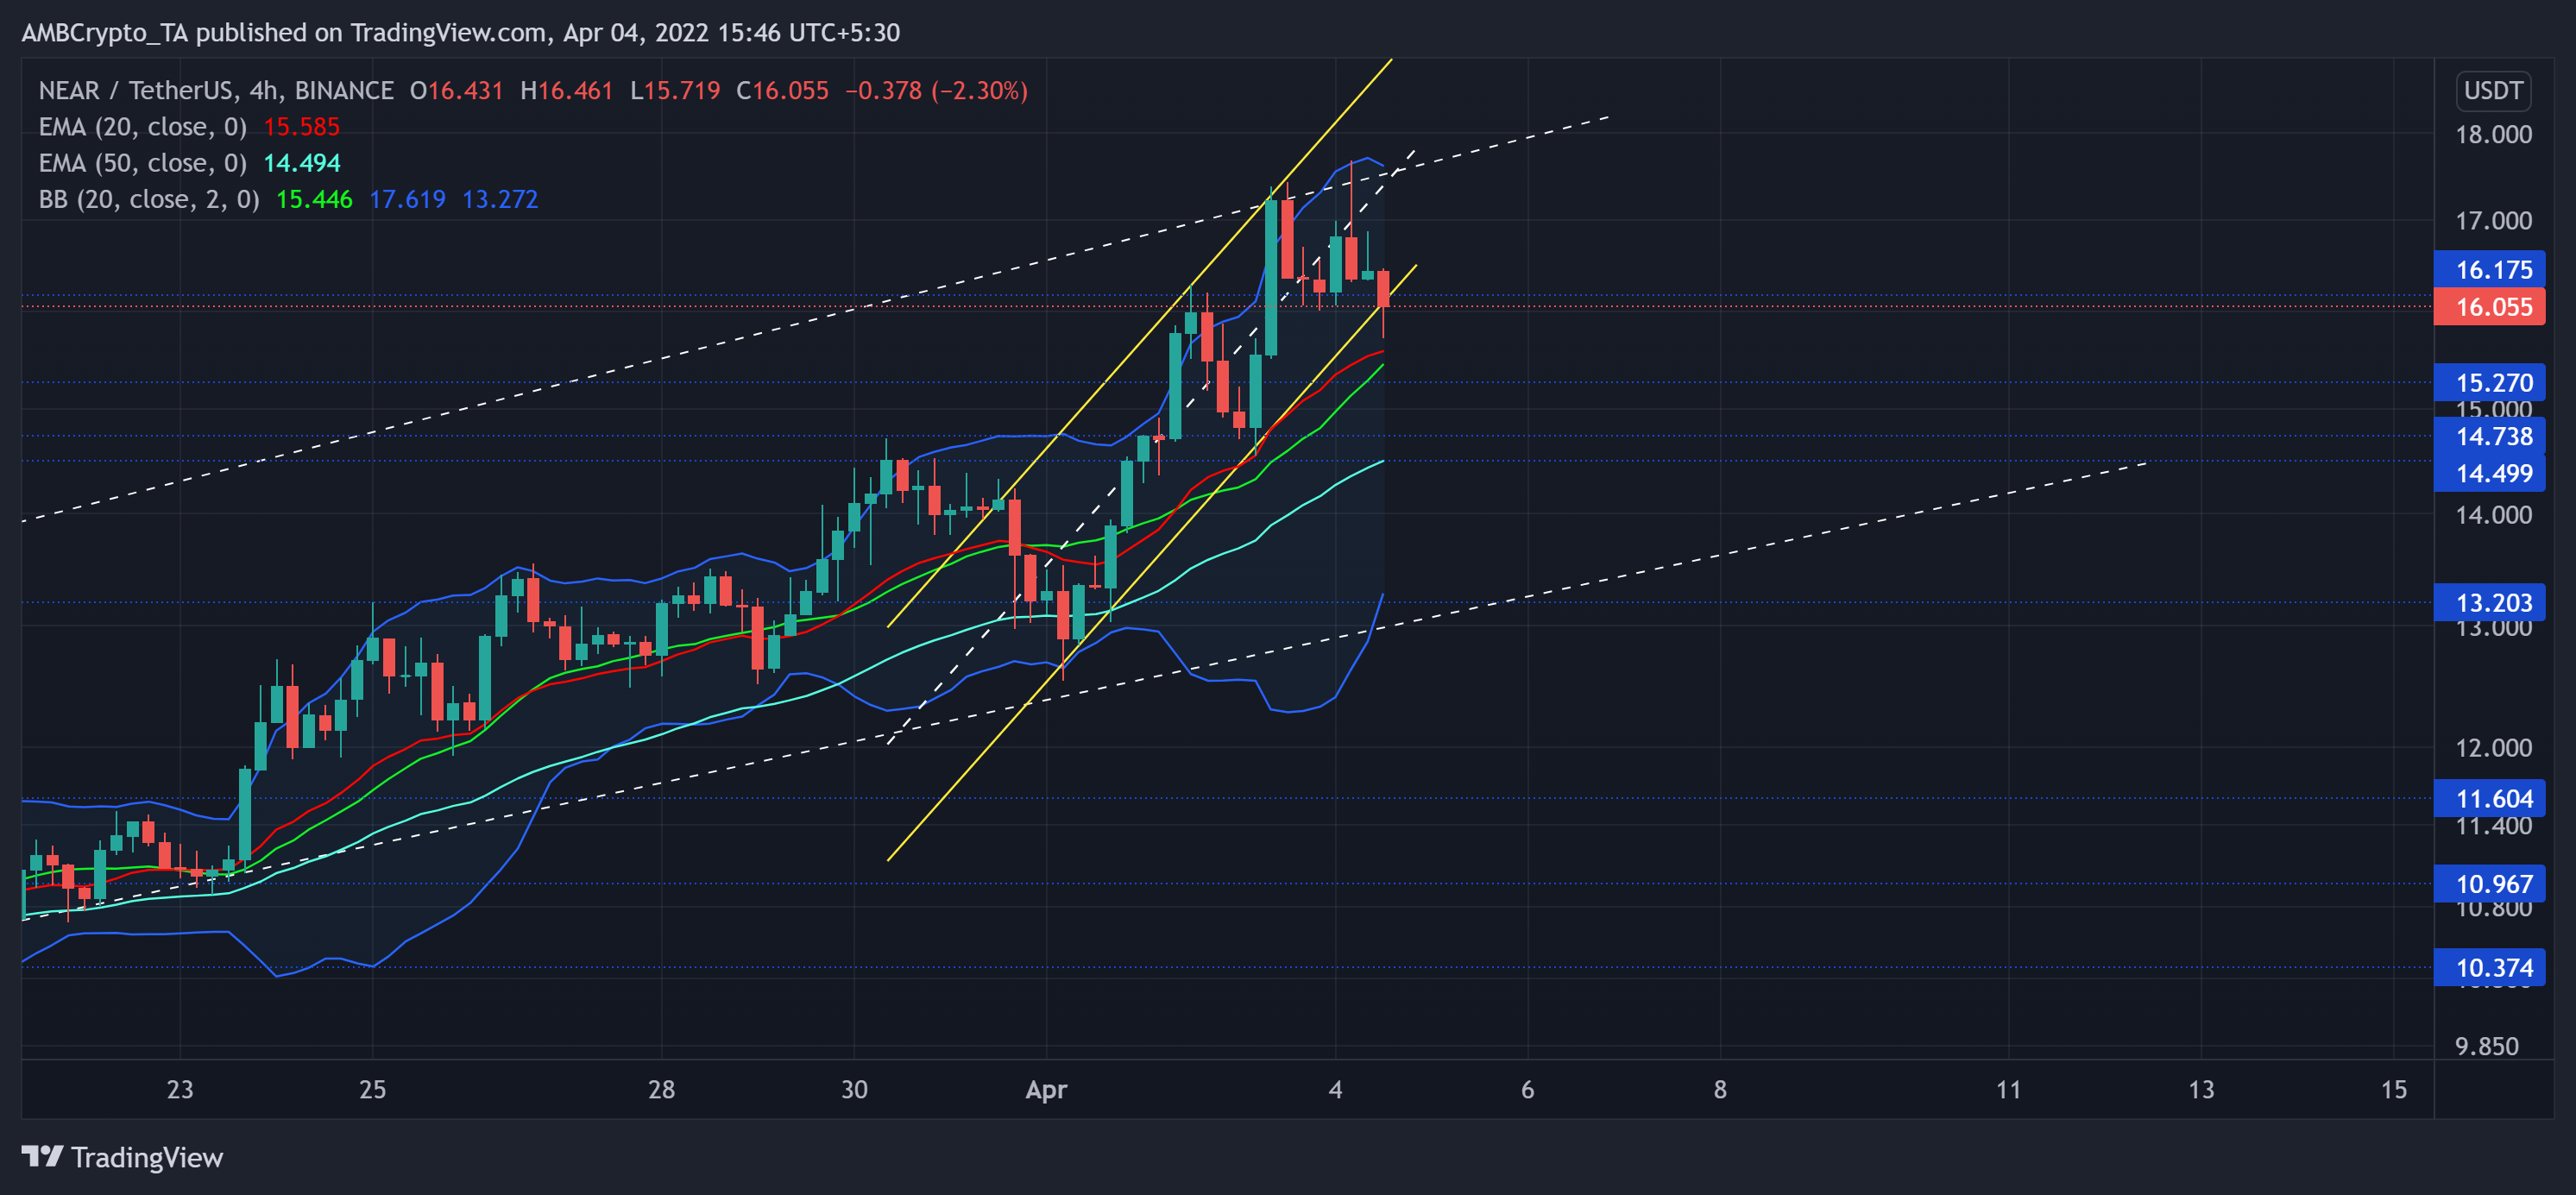
Now, a close below the ascending channel (yellow) would position NEAR for a test of the $15-zone. Following this, the bulls would reveal their intentions in the coming days. A fall below that level could find a cushion near its 50 EMA (cyan) before a buying resurgence. At press time, NEAR traded at $16.055, down by 5.34% in the last 24 hours.
NEAR 4-hour Chart
Since its ATH, NEAR lost more than 64% of its value and plunged toward its 11-week low on 24 February. It lost its crucial price points as the bears were in the driving seat.
NEAR adhered to its trendline support while falling towards the $7.6-long-term support. Consequently, it bounced back to witness five-week trendline support (white, dashed). As a result, the alt swayed above its 20/50/200 EMA (red) during the ascent.
From here on, any close below the current channel could push the price towards the $15-mark. If the sellers continue their spree, a retest of the 50 EMA (cyan) could be conceivable before a possible bullish comeback. Furthermore, the price was near the upper band of the Bollinger Bands (BB) and now approached its mean. This mean could serve an as important area of value for the investors/traders.
Rationale
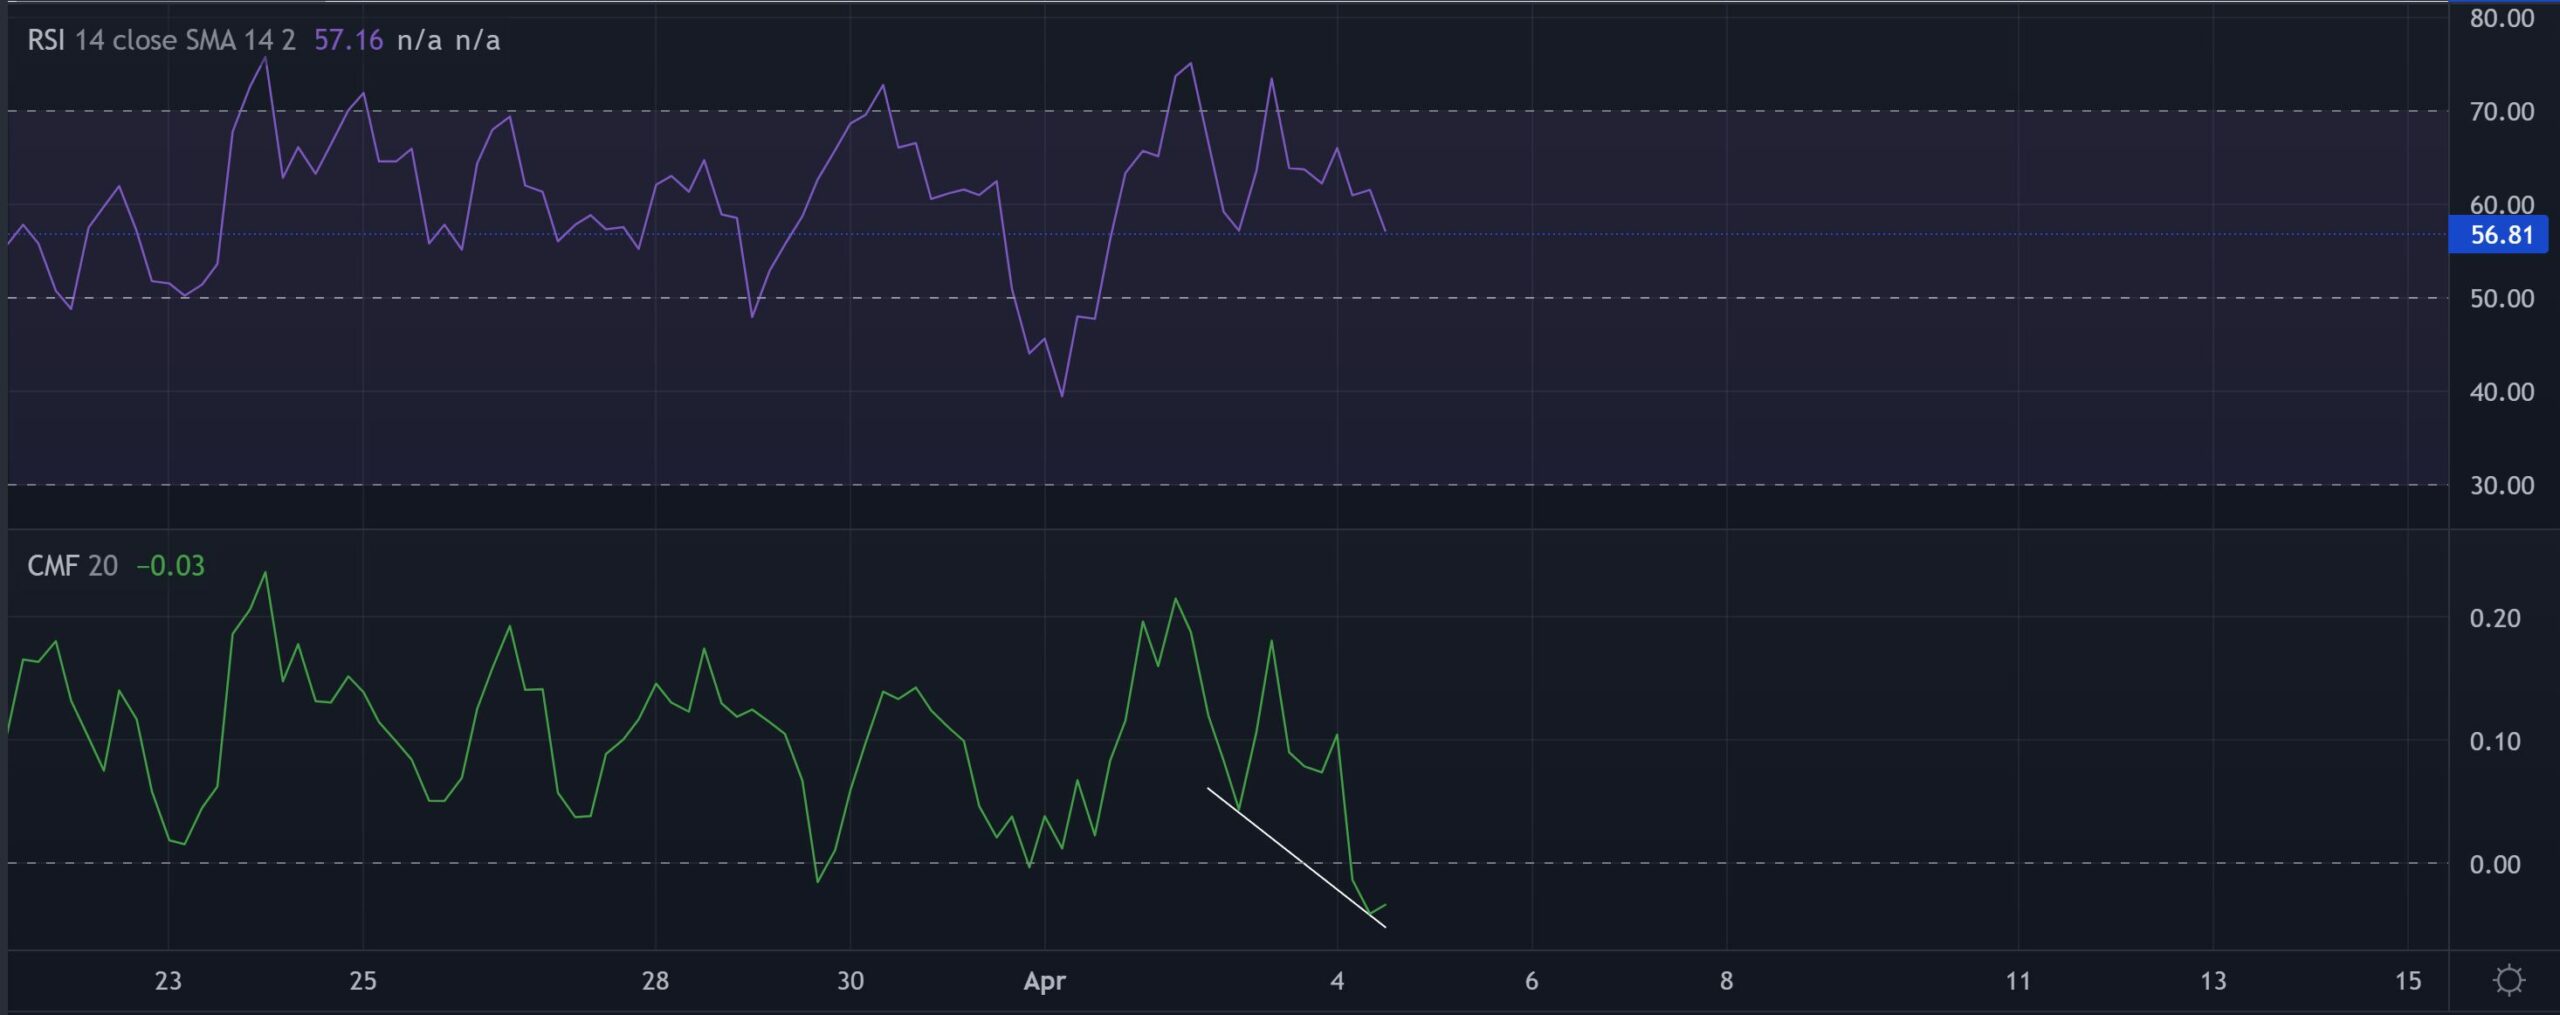
The RSI has been on a gradual decline since reversing from the overbought territory. Over the last day, it saw lower troughs while the price marked higher highs. This trajectory pointed at a possible hidden bullish divergence on its 4-hour chart.
Alas, the CMF plunged below the zero-line and affirmed a preference for the sellers. But it corresponded with RSI and affirmed a hidden bullish divergence.
Conclusion
A compelling close below the current pattern could lead to a 20 EMA retest before the bulls trigger a comeback. If the buyers do step in, at the $15-mark, it would confirm these hidden divergences and keep the revival hopes alive from the $14-$15 zone. Besides, the investors/traders must keep a close on Bitcoin’s movement affecting the market structure to make a profitable move.


