Chainlink: Plotting the odds of LINK bouncing back from its vital support level

Disclaimer: The findings of the following analysis are the sole opinions of the writer and should not be considered investment advice.
After hovering within the bounds of the $13-$35 range for over nine months, Chainlink (LINK) ditched its long-term floor amid multiple sell-offs. In the recent bear phase, the sellers kept lowering the baseline only to find fresher multi-month lows.
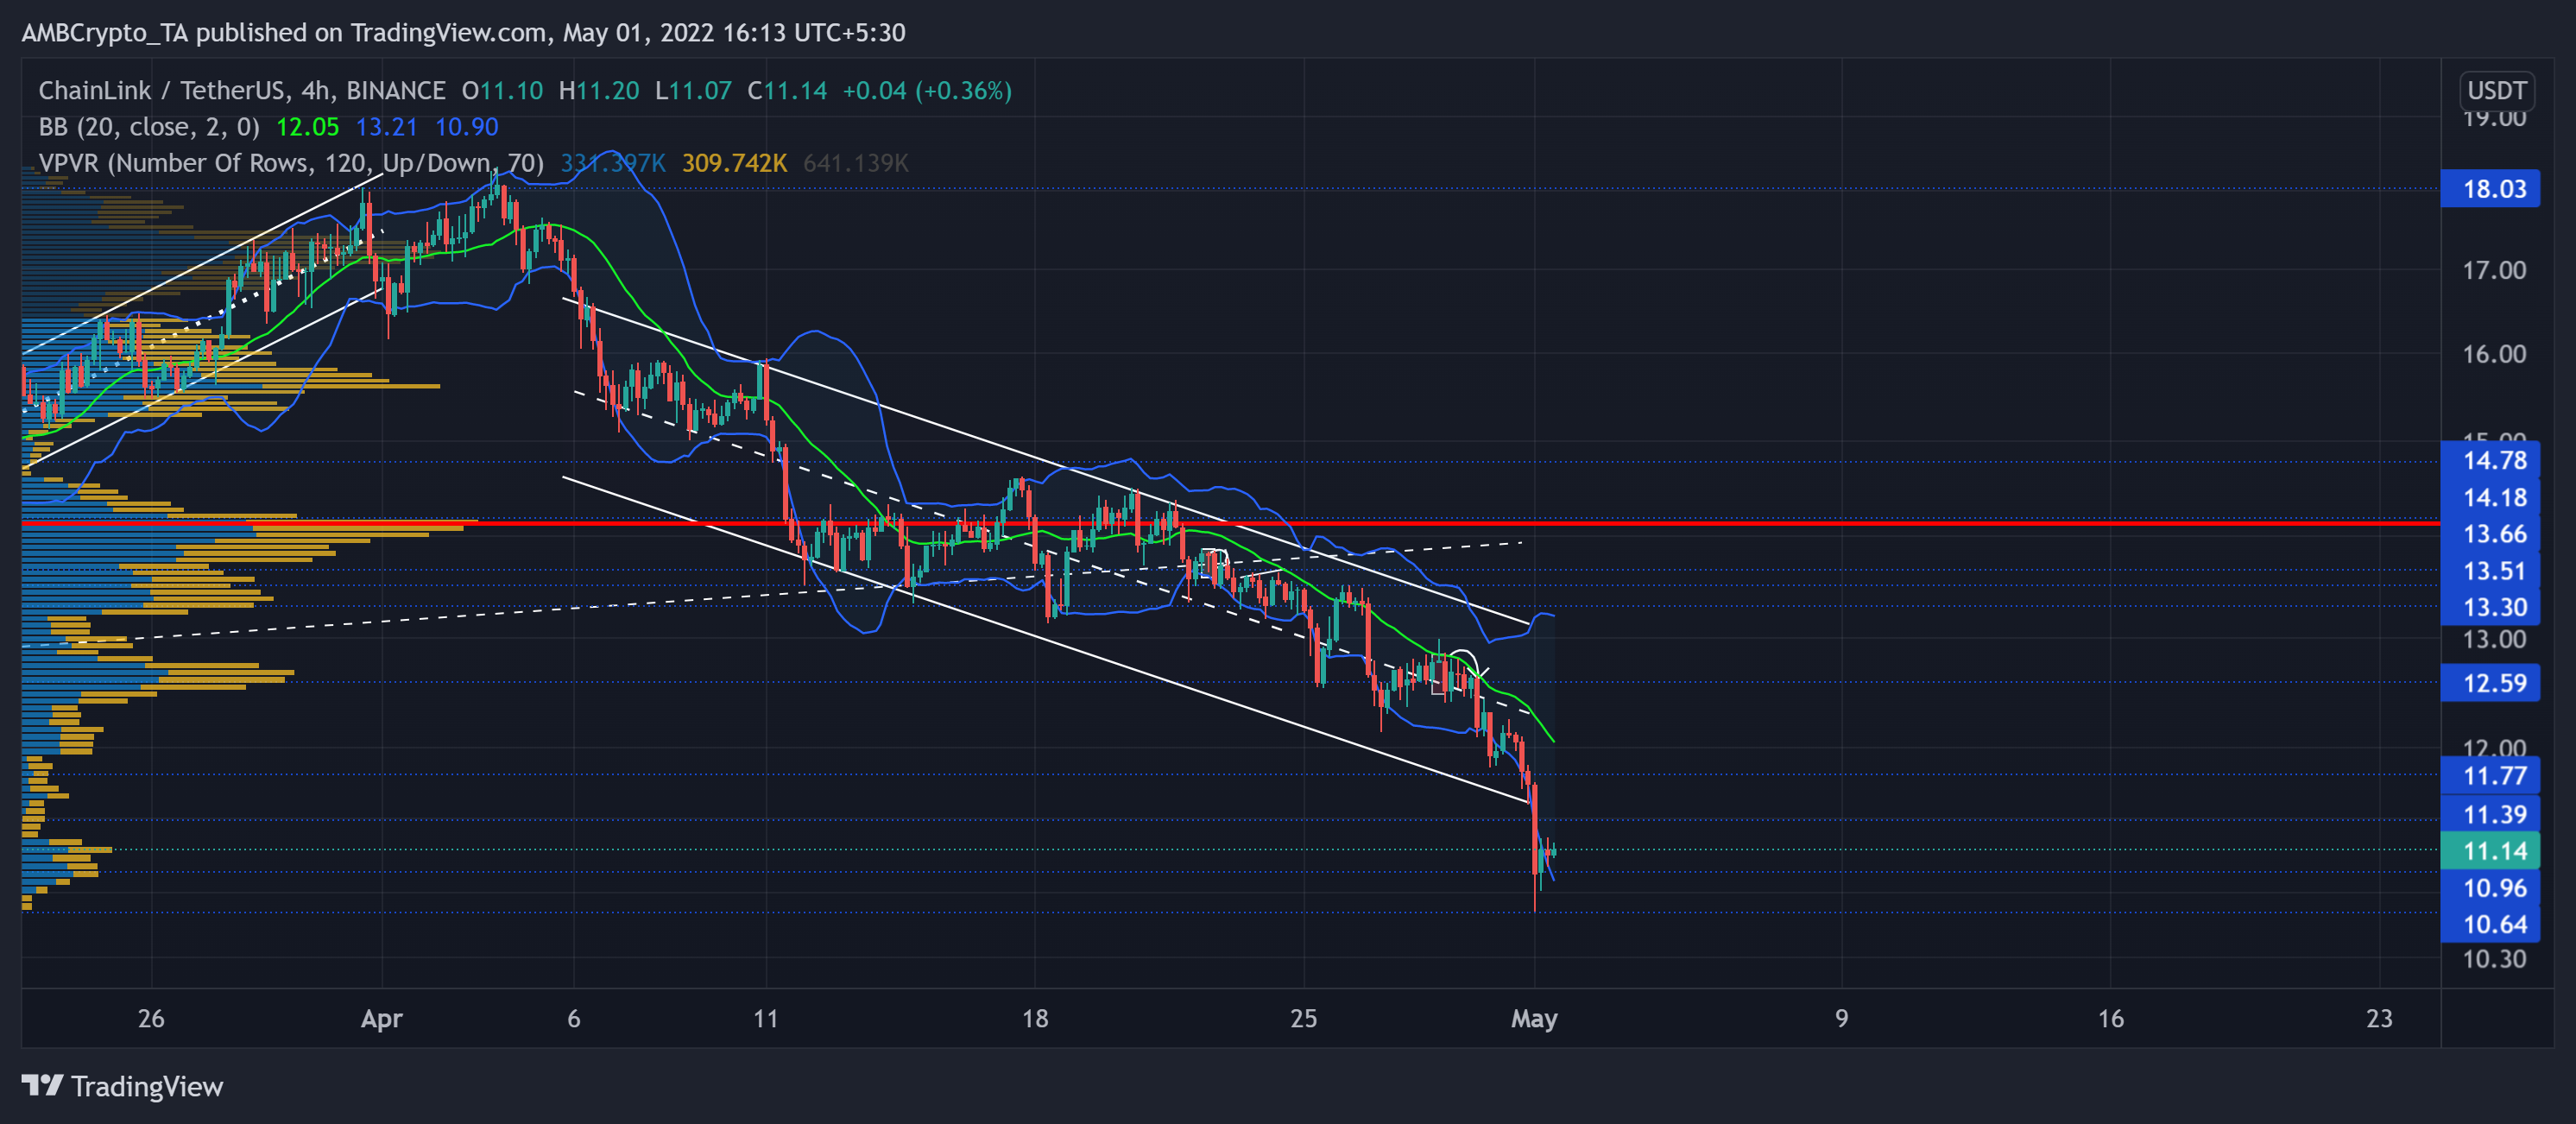
As the $10.96-level seemed to finally hold the steep fall, LINK could find itself recouping on the charts in the times to come. At press time, LINK was trading at $11.14, down by 7.2% in the last 24 hours.
LINK 4-hour Chart
Despite finding a cushion in the $13-zone for over nine months, the market structure gave enough impetus to the sellers. As a result, it became conducive for them to pull off a 41.74% drop over the last month.
Saving the Point of Control (POC, red) level was vital to continue a gradual recovery on LINK’s troughs. But the late April sell-off entailed a bunch of bearish engulfing candlesticks that pulled LINK below all the vital price points. After dragging the alt to its 16-month low on 1 May, the buyers finally found a restoring spot in the $10.6-zone.
After taking this enormous plunge, LINK’s Bollinger Bands (BB) broke into high volatility while its price gravitated toward the ‘cheaper’ or the lower band of the BB. A likely recovery from the current lows would expose LINK for a retest of the $11-$12 range before a trend committal move. To overturn the basis line (green) of BB, the alt would need to break convincingly above the $12-mark on strong volumes.
Rationale
After being able to barely stick its neck above the equilibrium, RSI’s momentum was visibly in the hands of bears. The recent selling spree was the muse for its recent plummet to its 14-week low. Such a strong devaluation toward the oversold mark could now expose LINK to short-term recovery.
Furthermore, the gap between –DI (red) and +DI (green) signified an overstretched bearish wedge on the 4-hour timeframe. So, probable ease in the selling pressure could pave a path for a revival rally.
Conclusion
Given the oversold readings on its BB and RSI alongside the overstretched situation on the DMI lines, LINK could aim to test the $10-$11 range. But unless the bulls step in to amplify the volumes, LINK could continue to depict a rather brittle recovery.
Finally, an overall market sentiment analysis will be vital. Especially to complement the technical factors and ascertain a profitable move.


![Kusama [KSM] explodes 119% in one day - How DOT helped](https://ambcrypto.com/wp-content/uploads/2024/11/Michael-KSM-400x240.webp)

