Ethereum lovers should watch out for these levels in the weeks to come

Disclaimer: The findings of the following analysis are the sole opinions of the writer and should not be considered investment advice
Data from Santiment showed a dramatic increase in transaction volumes for Ethereum in the past two days. Moreover, the number of addresses at a loss on the Ethereum network reached a new ATH, which was a particularly bearish development. Do such vast losses mean that a relief rally is just around the corner, or is more pain in stock for investors?
In other news, the Ethereum Merge was likely to arrive in the coming weeks, but can this positive news rescue the bulls?
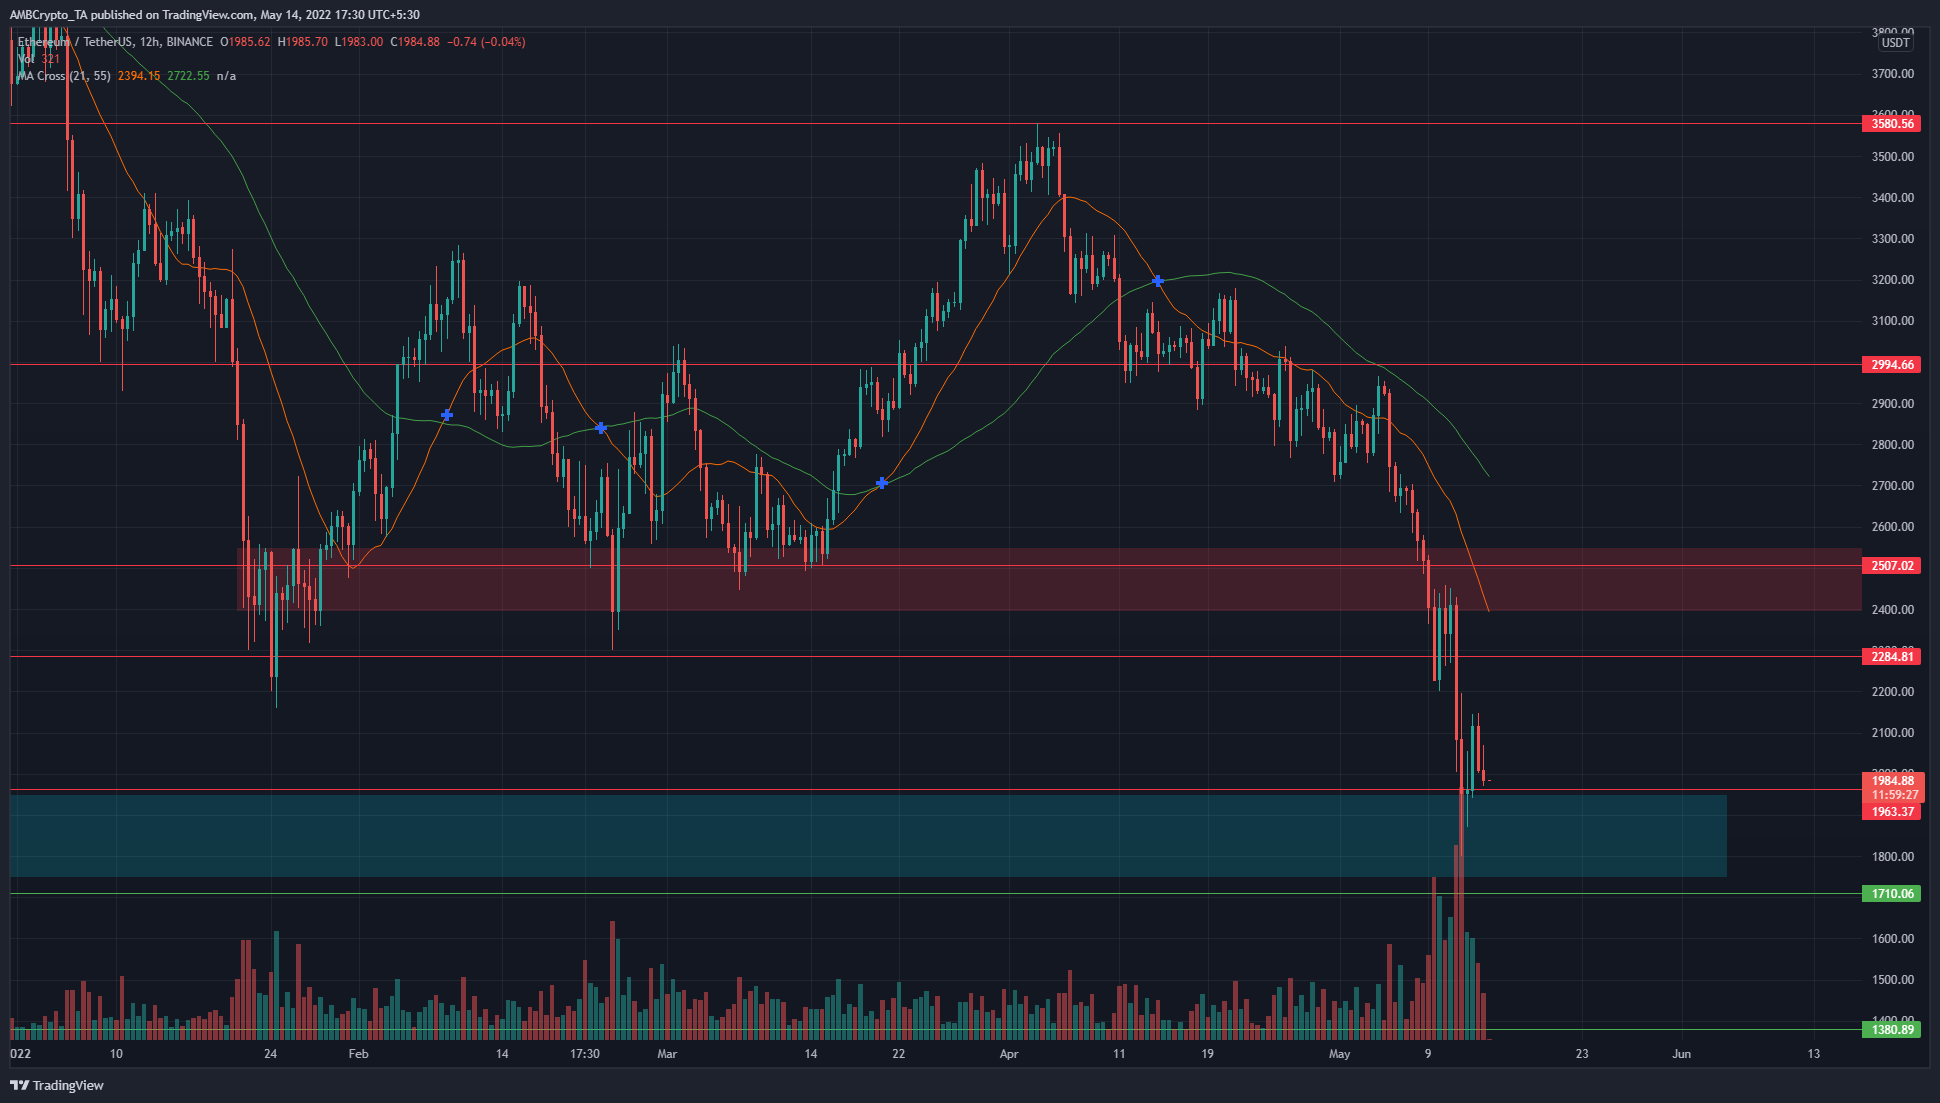
ETH- 12 Hour Chart
The $1800-$1950 area (cyan box) acted as an area of demand last June and July, and the price was able to rally from these lows to set new ATHs at $4800. Can the same feat be repeated?
It could, but there is a lot that needs to go the way of the bulls for such a scenario to unfold again. As things stand, fears of inflation and the tanking global stock indices have had a negative impact on the crypto market.
The market structure of ETH appeared to flip bullish, for a few brief days in March, but the price fell back below the $3300 mark and, quickly thereafter, the $3000 mark as well. This development meant that the previous downward trend was not quite broken.
As things stand, the $2280 and $2500 levels are likely to be strong resistance levels for Ether in the weeks to come. The zone of demand just below $2000 could give a positive reaction in the next few days, and a bounce toward $2200 could occur.
Rationale
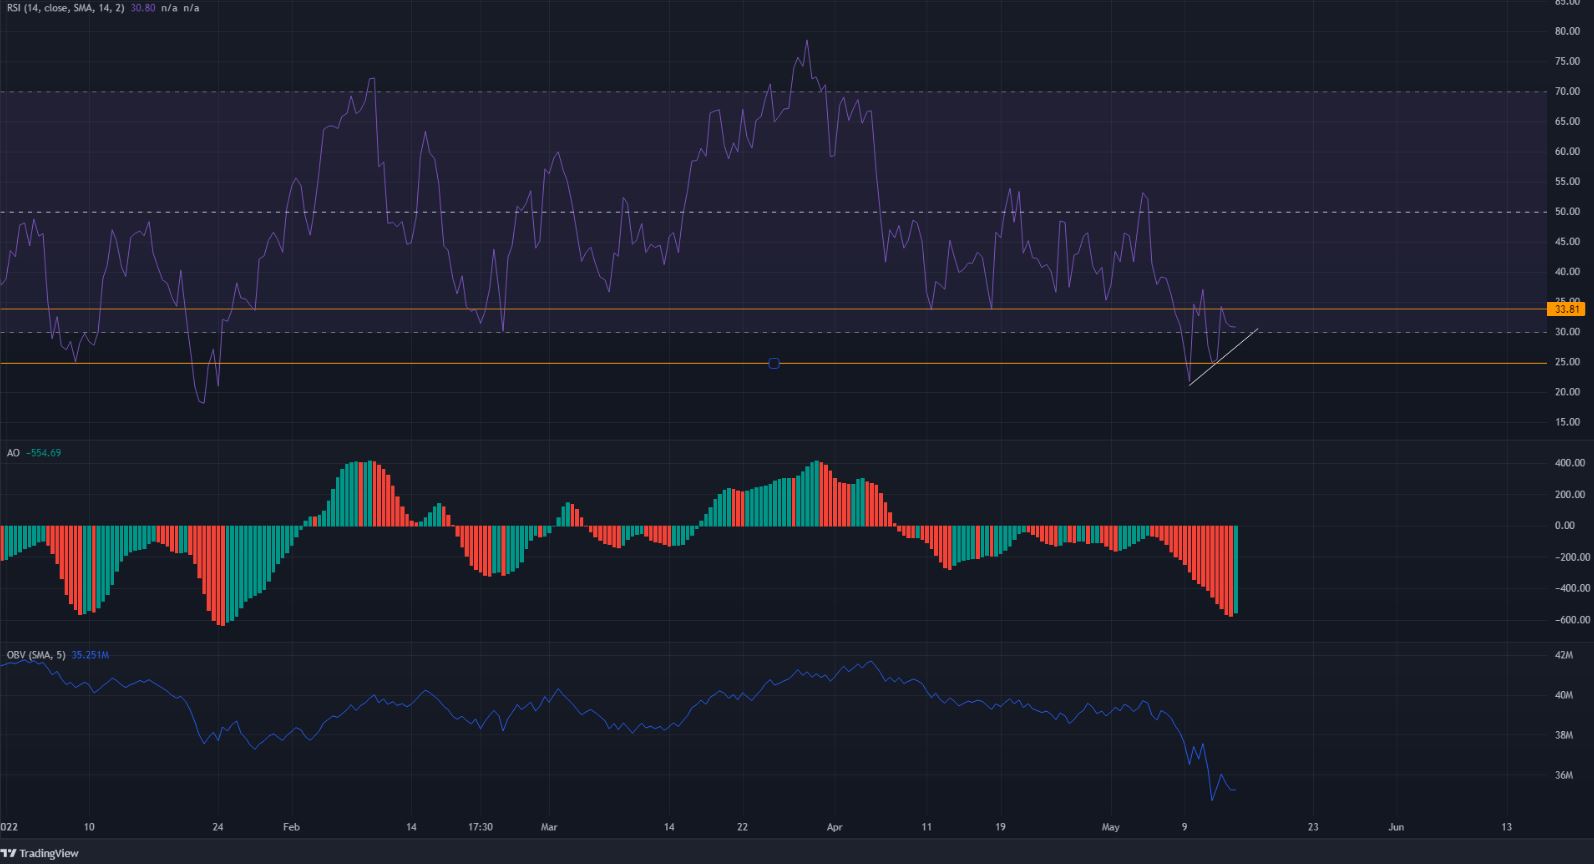
Even as the prices formed lower lows, the RSI made higher lows (marked in white). This was a bullish divergence that could produce a bounce in price, alongside the confluence with the demand zone. However, the 33 mark on the RSI has been important in the past, and it would need to climb above in order to resemble the bounce in late January. In that instance, once the RSI climbed out of the oversold territory and retested 33, the price began to climb from $2400 to $3200.
The Awesome Oscillator was also well beneath the zero line to show bearish momentum was strong, and the OBV also saw a massive dip in recent days to highlight the strength of the sellers.
Conclusion
A divergence would not be enough for the trend to reverse, and this market was not yet ready to establish a bullish trend. Lower timeframe traders can look for shorting opportunities, while investors would need to wait patiently for an opportunity to buy the asset.


