Looking to go long on LEO? Keep an eye out for this resistance zone

Disclaimer: The findings of the following analysis are the sole opinions of the writer and should not be considered investment advice.
Bitcoin had held on to the $30.1k mark as support over the previous day but was not able to withstand a wave of selling late into the day. The price fell beneath the $30k mark, and this fear saw many altcoins plummet down the charts as well. However, LEO has performed strongly on the charts in recent days. Although the coin has high volatility, it appeared set for a move toward the $5.7 resistance level.
LEO- 1 Hour Chart
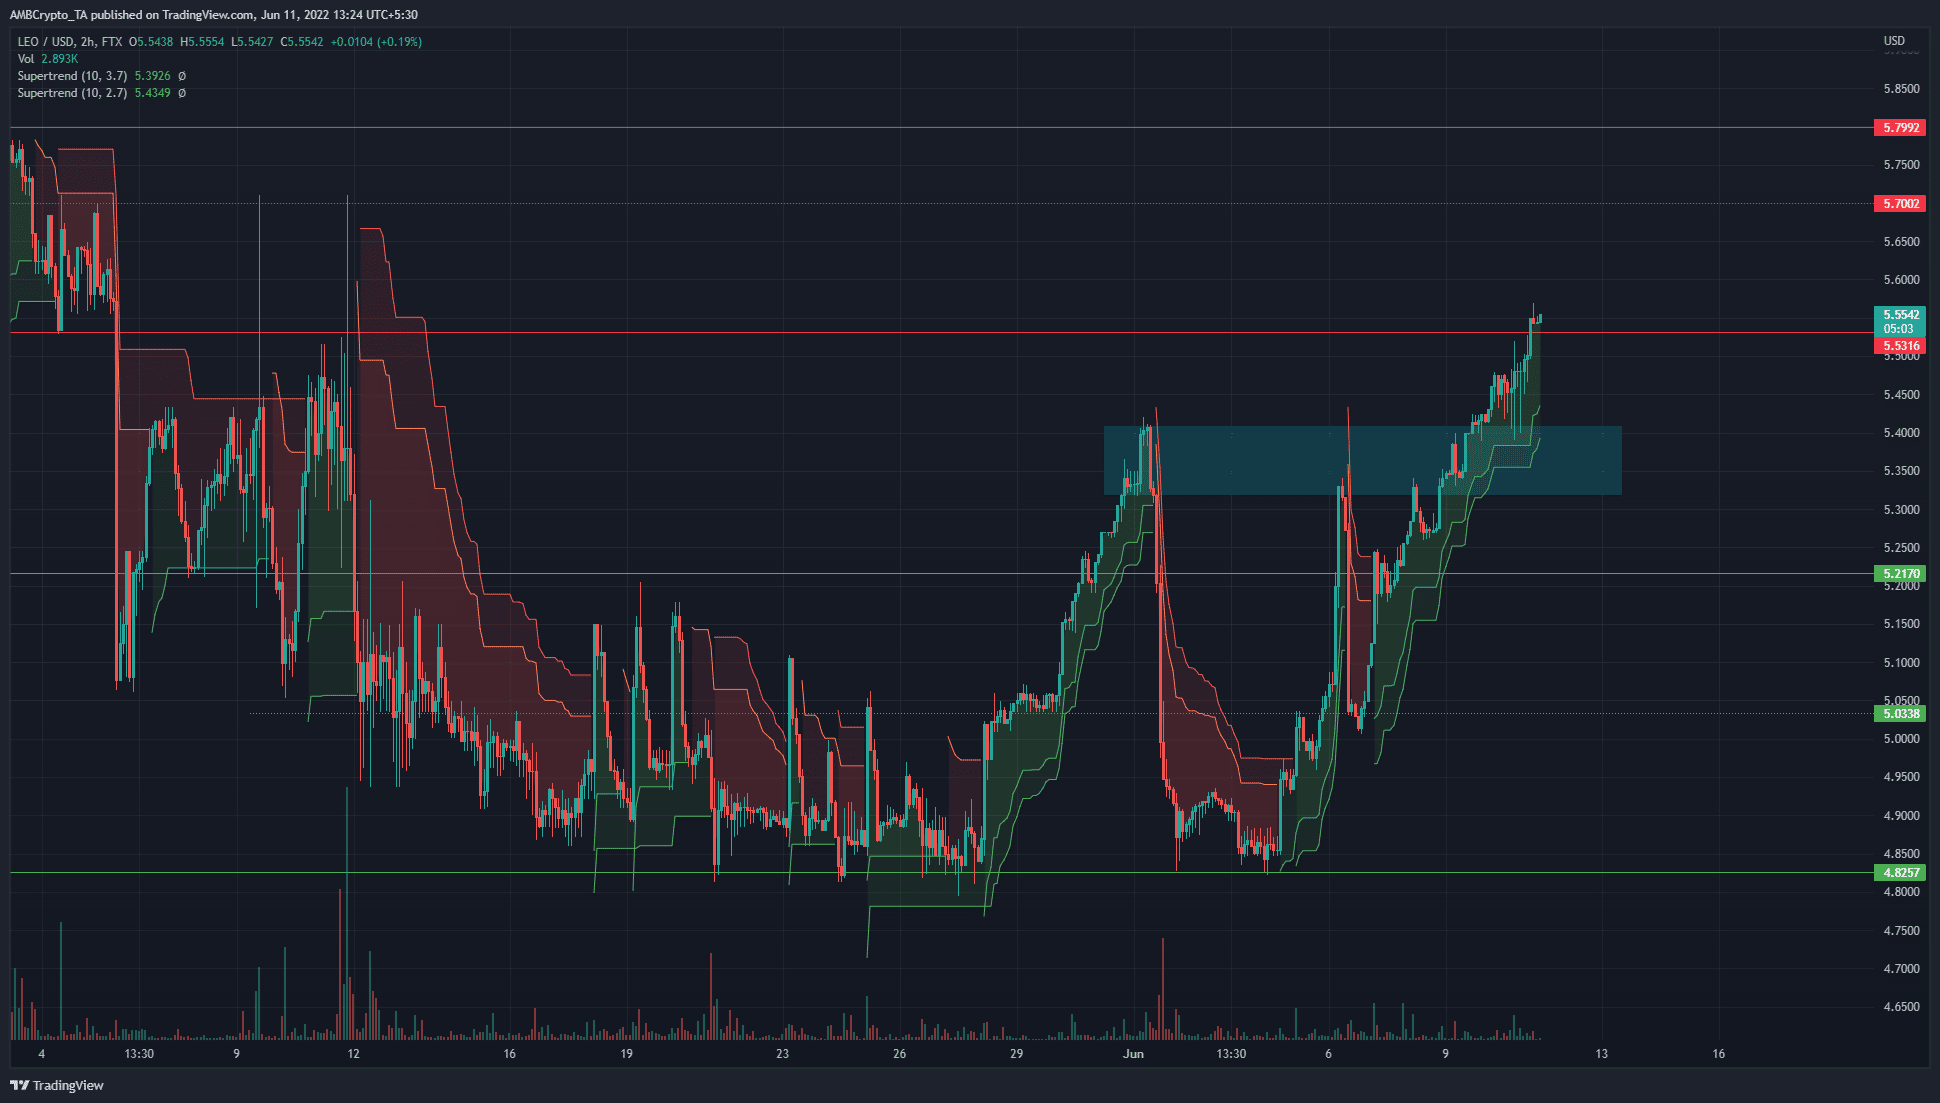
At the time of writing, LEO had crossed above the $5.53 resistance level and has retested it as support. Early in May, the price saw two long candlewicks to the upside that tested the $5.7 level as resistance. Therefore, this is a level that the price could be drawn to once again in the days to come.
The market structure on the lower timeframes was bullish. In late May, LEO saw a surge from $4.82 to $5.4, before falling back to $4.82 a couple of days later. However, since then, the price has steadily climbed.
The bulls were successful in flipping the $5.35 area from resistance to support, and a move further north to the $5.7-$5.8 resistance could be likely for LEO.
Rationale
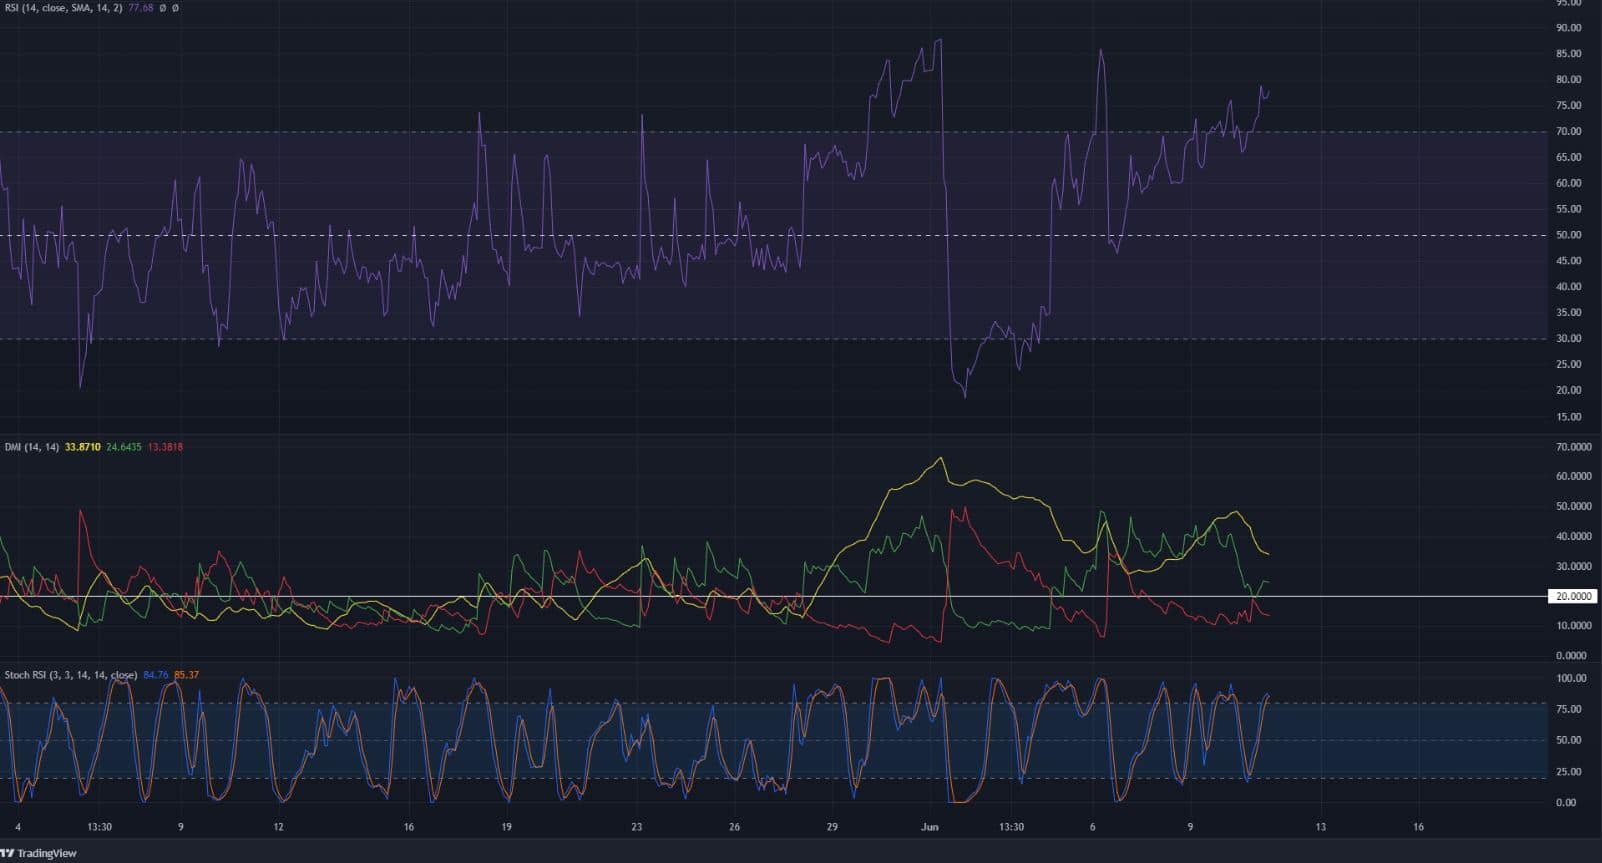
The two Supertrend indicators gave a buy signal for LEO on H2, but the Stochastic RSI was in overbought territory and could form a bearish crossover. The RSI was also in the overbought region, and a pullback could occur. Therefore, it could be a better option to wait for a dip to $5.4-$5.45 to buy LEO.
The DMI showed a strong uptrend in progress, with both the ADX (yellow) and the +DI (green) above the 20 mark.
Conclusion
The short-term structure as well as the momentum indicators favored the buyers. However, the $5.7-$5.8 area is a rigid resistance zone. Bitcoin’s direction in the next week could influence whether LEO sees a reversal or a bullish continuation in the next few days.