This price range could be key to Polkadot’s [DOT] near-term trajectory

Disclaimer: The findings of the following analysis are the sole opinions of the writer and shouldn’t be considered investment advice
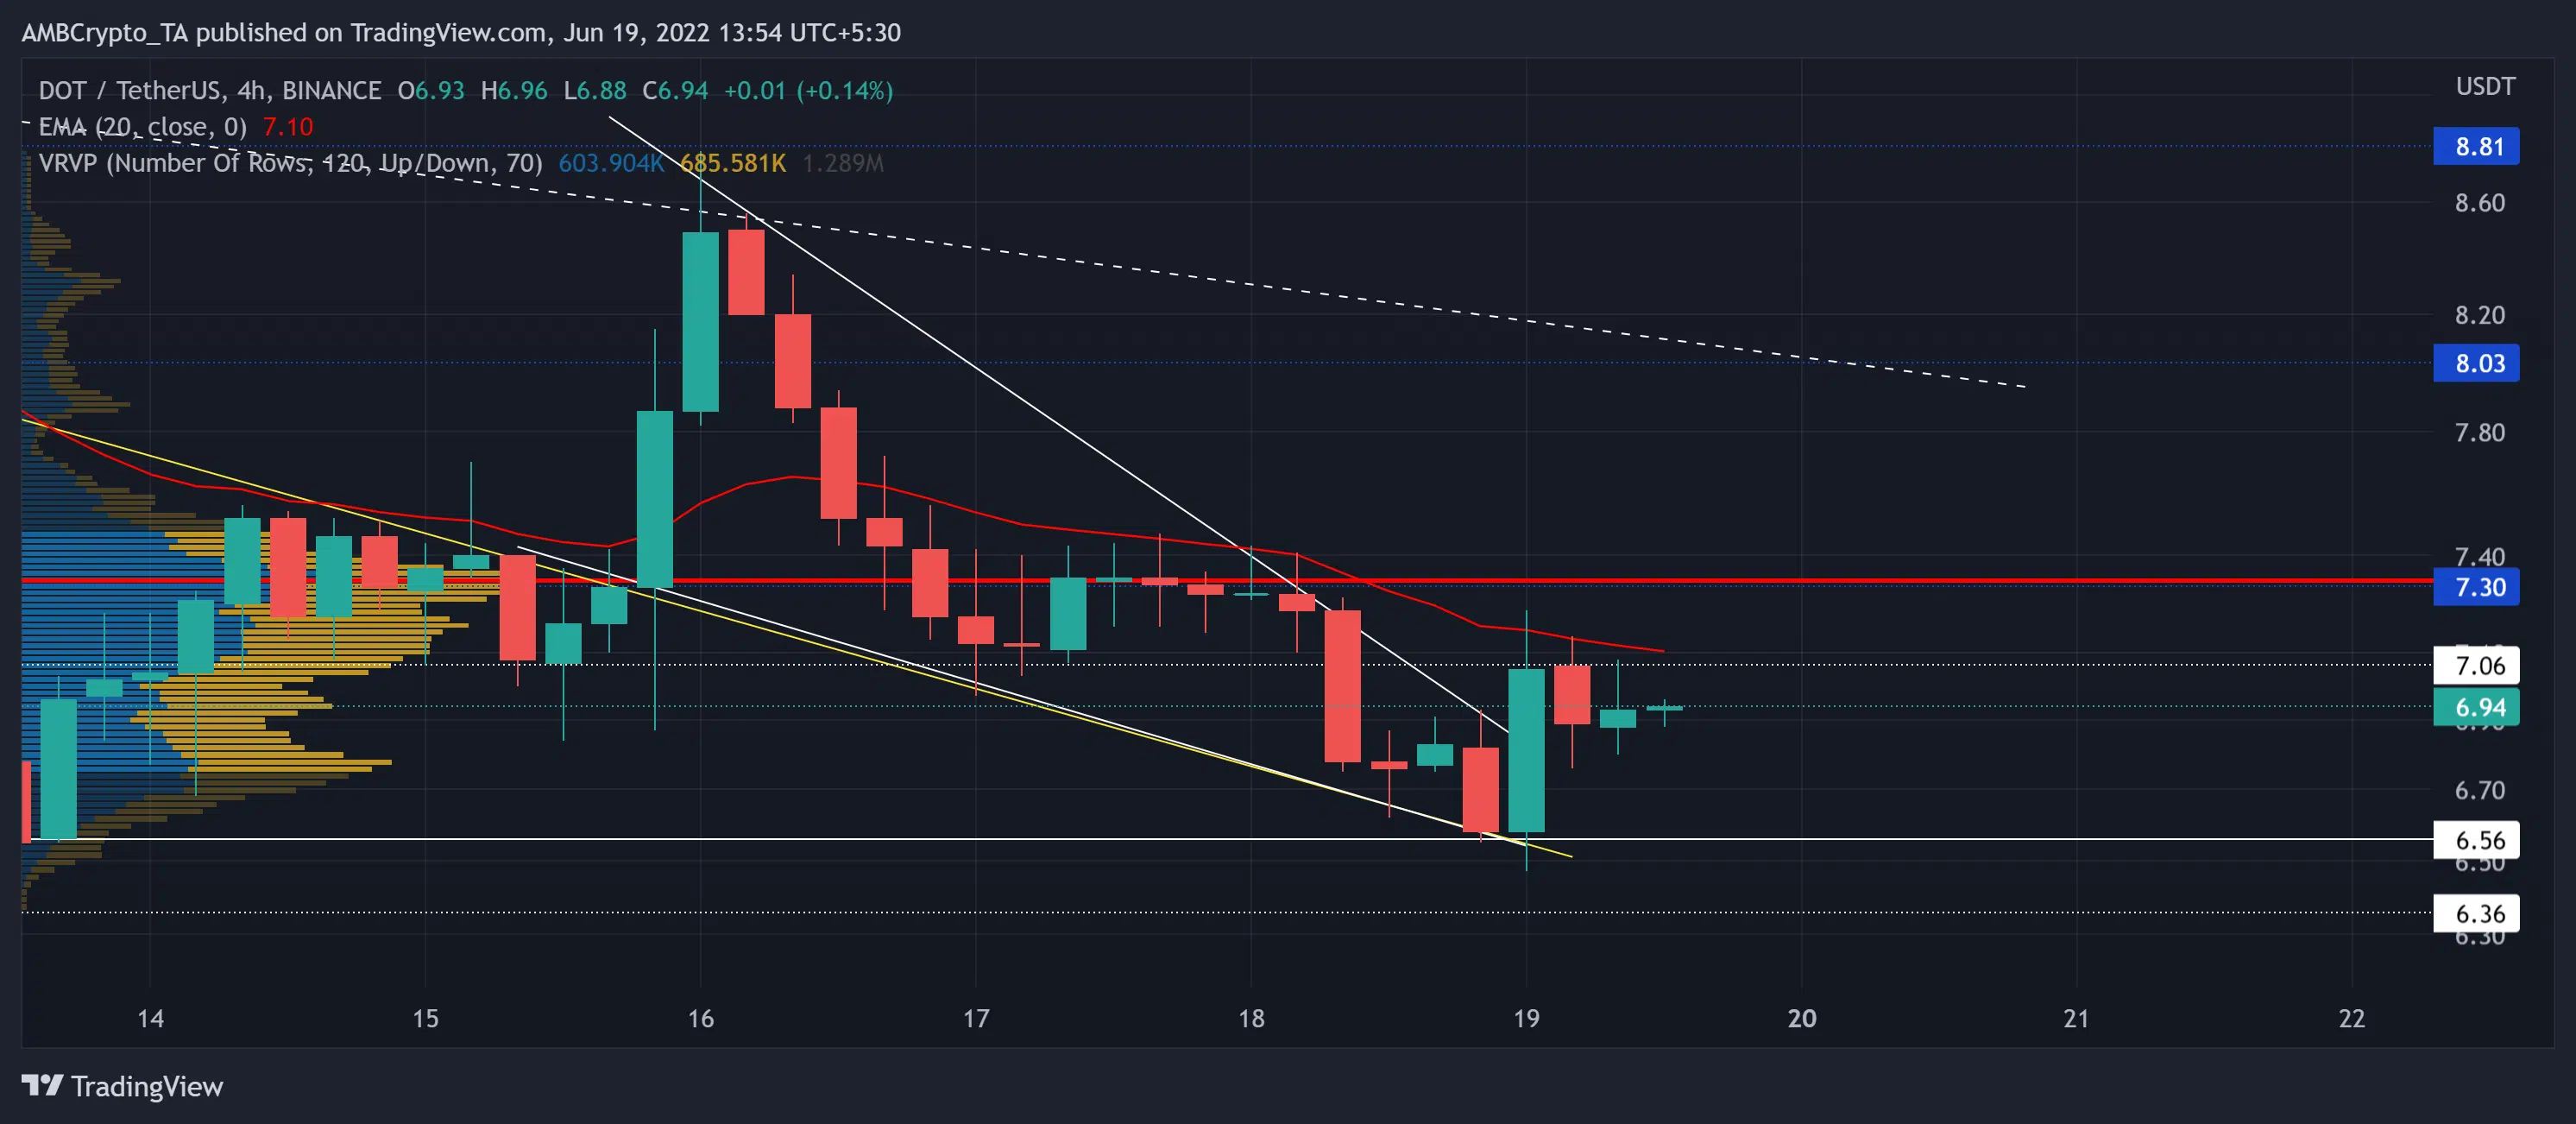
Polkadot [DOT] has steadily descended over the last few months. During this phase, the six-week trendline resistance (white, dashed) has curbed recent bullish revival attempts. The buyers defended the $6.5-support for over 17 months while the sellers kept finding fresher lows.
The recent rebound did help the alt break out of its falling-wedge-like structure. But the 20 EMA (red) resistance can impair DOT’S near-term recovery.
At press time, DOT was trading at $6.94, up by 3.28% in the last 24 hours.
DOT 4-hour Chart
Recent retracements pulled DOT towards its 17-month low on 13 June after a 33% three-day drop (10-13 June). Since then, the buying efforts have seen a rebuttal by the six-week trendline resistance. This fall formed a short-term falling wedge in the 4-hour timeframe.
DOT’s previous uptrend reaffirmed the chances of an upward break from the wedge. Also, the breakout day buying volumes were comparatively higher than usual.
Given the $6.5-mark support level coinciding with the patterned breakout, DOT could find some buying pressure in the coming sessions. In such a case, traders/investors need to look for a close above the 20 EMA and the Point of Control (POC, red) to time profitable entries. In this case, the buyers would aim to retest the $8-resistance.
However, an inability to break the chains of the $7-$7.3 range could continue the sluggish behavior on the charts.
Rationale
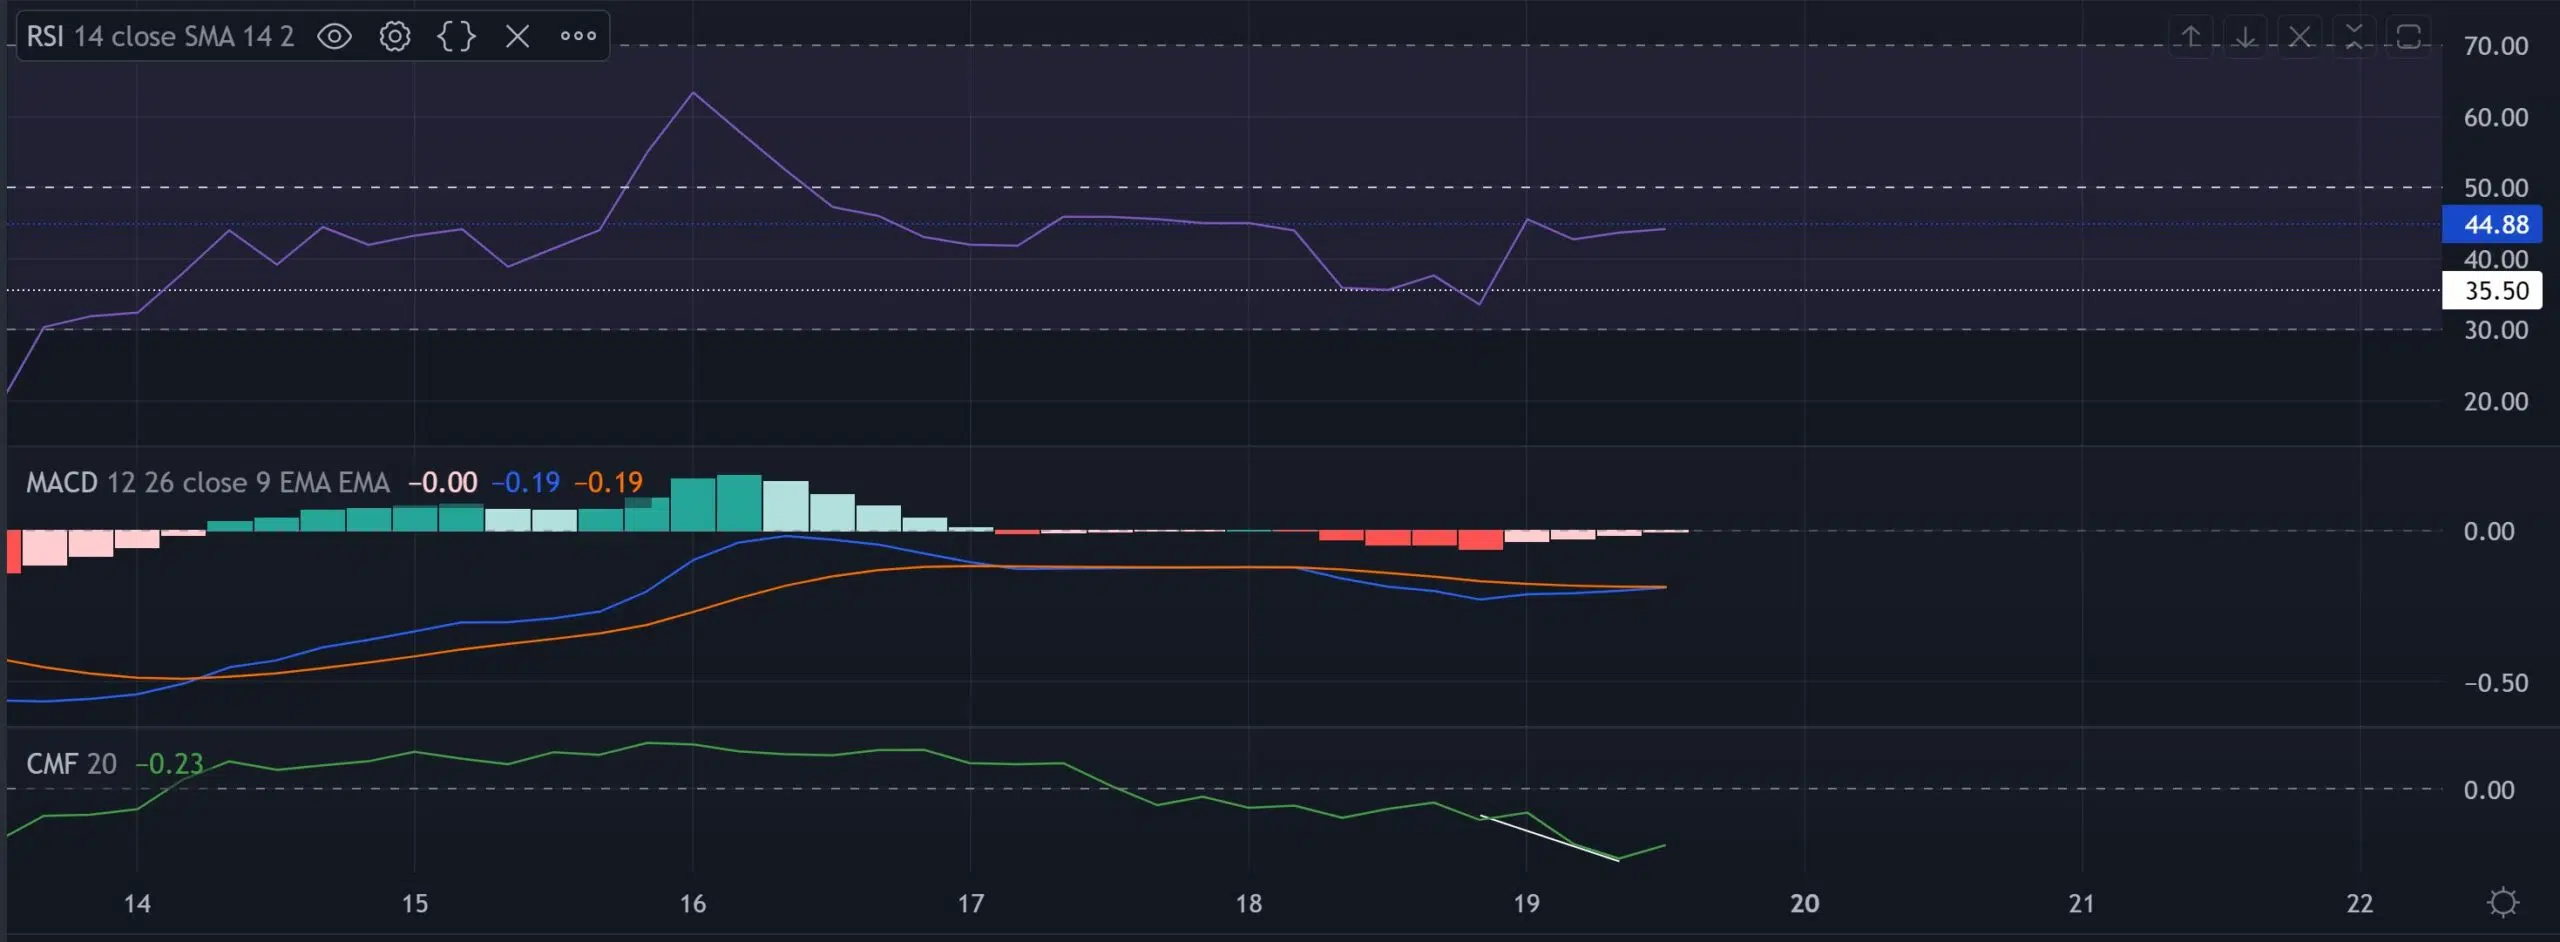
The RSI’s growth from the 35-mark has helped it retest the 44-mark resistance. To reopen robust recovery chances, the index needs to find a close above this level. Also, the bullish divergence with price provoked a slight uptick in the bearish CMF.
The MACD lines have projected ease in selling power over the last 24 hours. However, until these lines cross equilibrium, buyers would find it difficult to change the broader narrative.
Conclusion
In view of the current market structure, the altcoin would likely face difficulties to inflict a strong bull run. But the indicators suggested ease in selling power in the four-hour timeframe. A close above the $7.$7.3 range is needed to confirm the buying edge.
Finally, an overall market sentiment analysis becomes vital to complement the technical factors to make a profitable move.


