If Solana [SOL] defends this zone, probability of a move higher would be high

Disclaimer: The findings of the following analysis are the sole opinions of the writer and should not be considered investment advice.
Despite the strong bounce from the $18k lows, Bitcoin [BTC] has a bearish outlook on the longer timeframe charts. In order to initiate a recovery, BTC would need to climb past the $23k mark and stay above.
Yet, even though Bitcoin languished near the $20k mark, Solana [SOL] has been able to post decent gains in the past couple of weeks. At press time, it appeared to retest a former supply zone as demand and presented a buying opportunity.
SOL- 12-Hour Chart
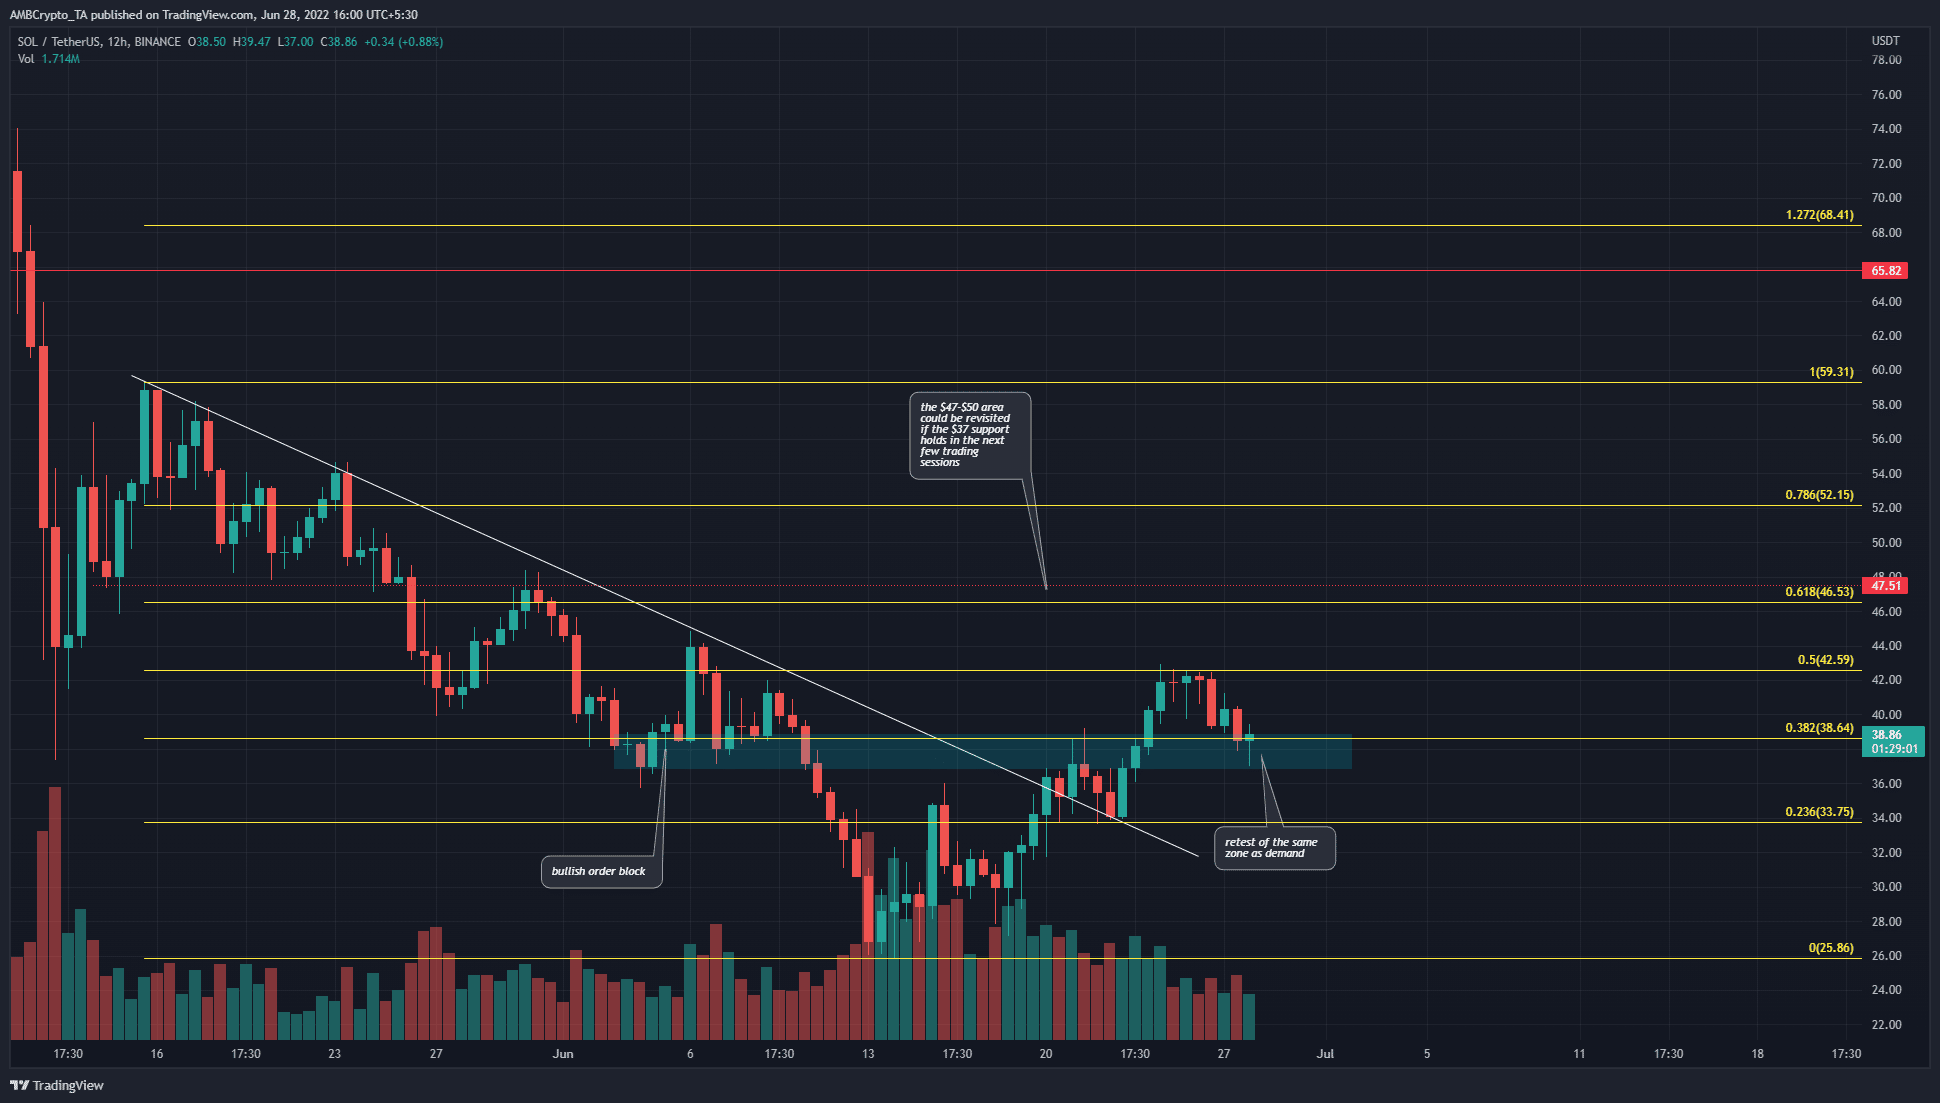
The Fibonacci retracement levels were drawn from the swing high at $59.31, and the swing low at $25.86. Preceding this move, April and May had been extremely bearish for Solana. The asset was trading at $140 in early April but later saw a relentless tumble to take it to the $25 area.
The retracement levels showed that the 38.2% and 50% retracement levels have acted as resistance in the past week. Moreover, at press time, the price appeared to be retesting the $38.64 level as support.
In addition, early in June, the $36.8-$38.8 had served as an area of demand. SOL saw a swift bounce from this area as high as $44, before slumping lower yet again. Therefore, in the next few days, this same area could act as demand once more and SOL might be able to rally. To the north, the $47-$49 was a stiff resistance zone.
Rationale
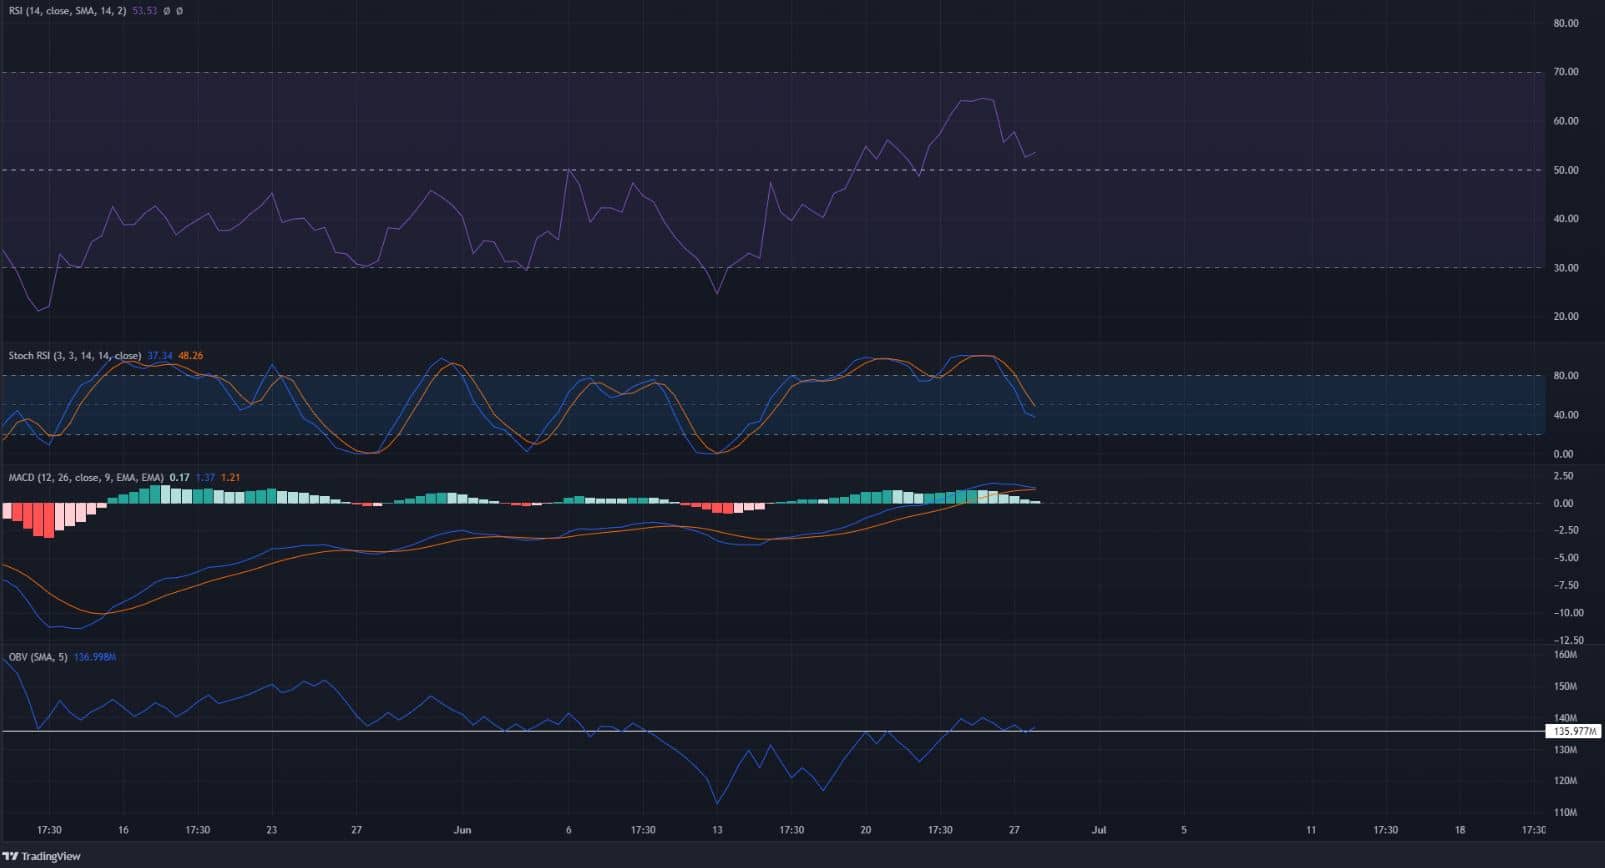
On the H12 chart, the RSI climbed back above the neutral 50 line a few days ago and retested it as support. This hinted at the shift in momentum from bearish to bullish. Shortly thereafter, even the MACD managed to force its way above the zero line.
Together, the inference was that the momentum had shifted in favor of the buyers. But what of the OBV? On the OBV, there was a slight upward movement in the past ten days. Hence, buying volume has been weak but present.
It was able to rise above previous resistance at the white line, which was mildly encouraging. However, strong demand was not yet present, so long positions need to remain extra vigilant.
Conclusion
The overall picture remained bullish for Solana. Was this a reversal of the downtrend from April? No, yet, a move toward $50 could be around the corner. If SOL can defend the $37 demand zone, another move higher would be more likely for Solana.


