Zcash revisiting this demand zone could signal buying opportunity

Disclaimer: The information presented does not constitute financial, investment, trading, or other types of advice and is solely the writer’s opinion.
Earlier in July, Bitcoin had a hopeful look about it on the charts. The bulls had watched BTC post higher lows at $18.8k and $19.2k two weeks into July.
To the upside, the king of crypto pushed past the $21.7k resistance to reach $24k. However, this bullish impulse of the past week was swiftly halted.
Over the weekend, Bitcoin began to bleed lower, and the rest of the altcoin market followed in its footsteps. Zcash quickly descended from $65 to $56. In doing so, it flipped the $60 level to resistance and gave the bears a huge boost. Could ZEC drop beneath its range as well?
ZEC- 12-Hour Chart
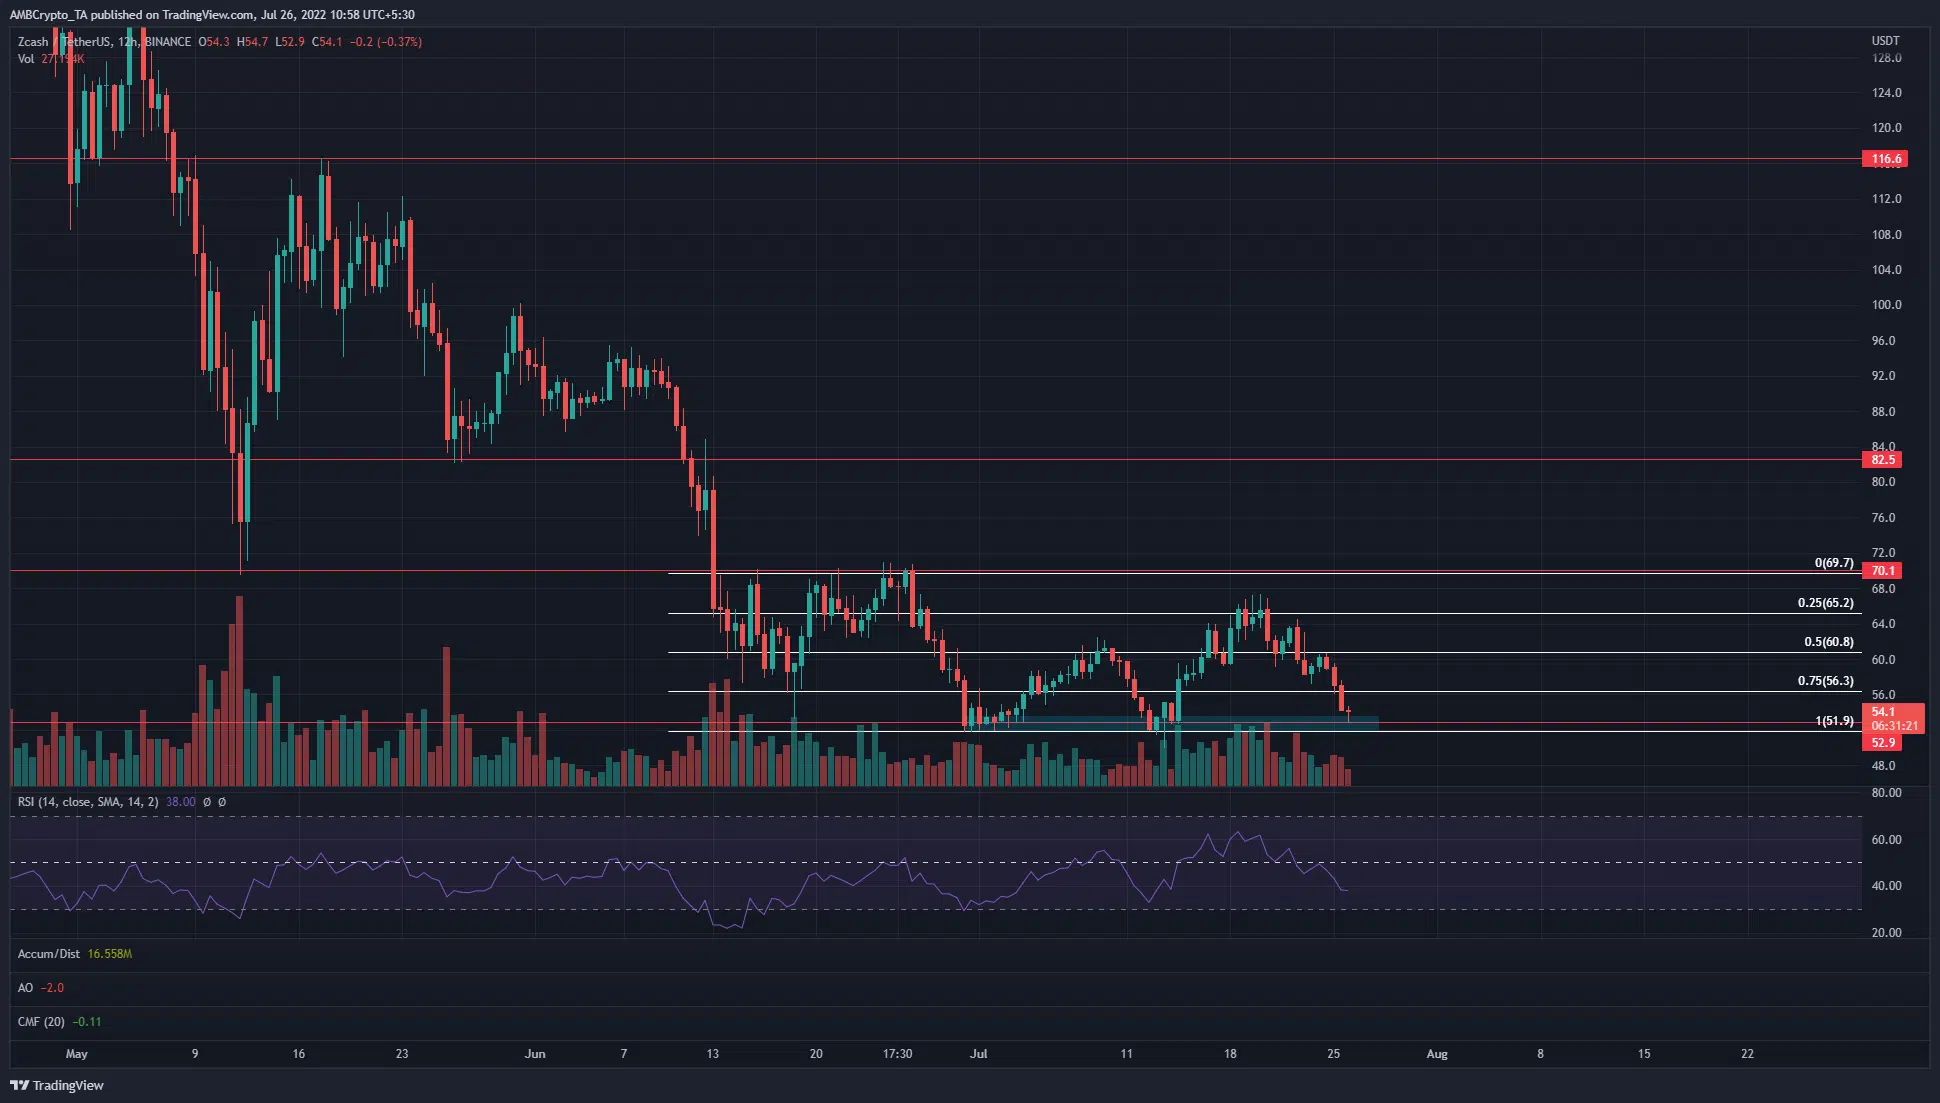
ZEC formed a range between $69.7 and $51.9 in late June when the high and the low were tested quickly. In doing so, a zone of demand was established at $52, highlighted in cyan. Before the formation of the range, Zcash had been in a strong downtrend.
In late May, the $76-$82 area was seen as a support zone, but ZEC crashed right past it in the selling wave in mid-June. Going back to April, this was something that ZEC had often done.
It saw strong shorter timeframe rallies, each of whom was rejected at a previous lower high on the downtrend.
The 12-hour RSI was beneath the neutral 50 line to indicate a downtrend in progress. In terms of price action, the $69.7 level was the downtrend’s significant lower high to beat to flip the longer-term market structure.
ZEC- 4-Hour Chart
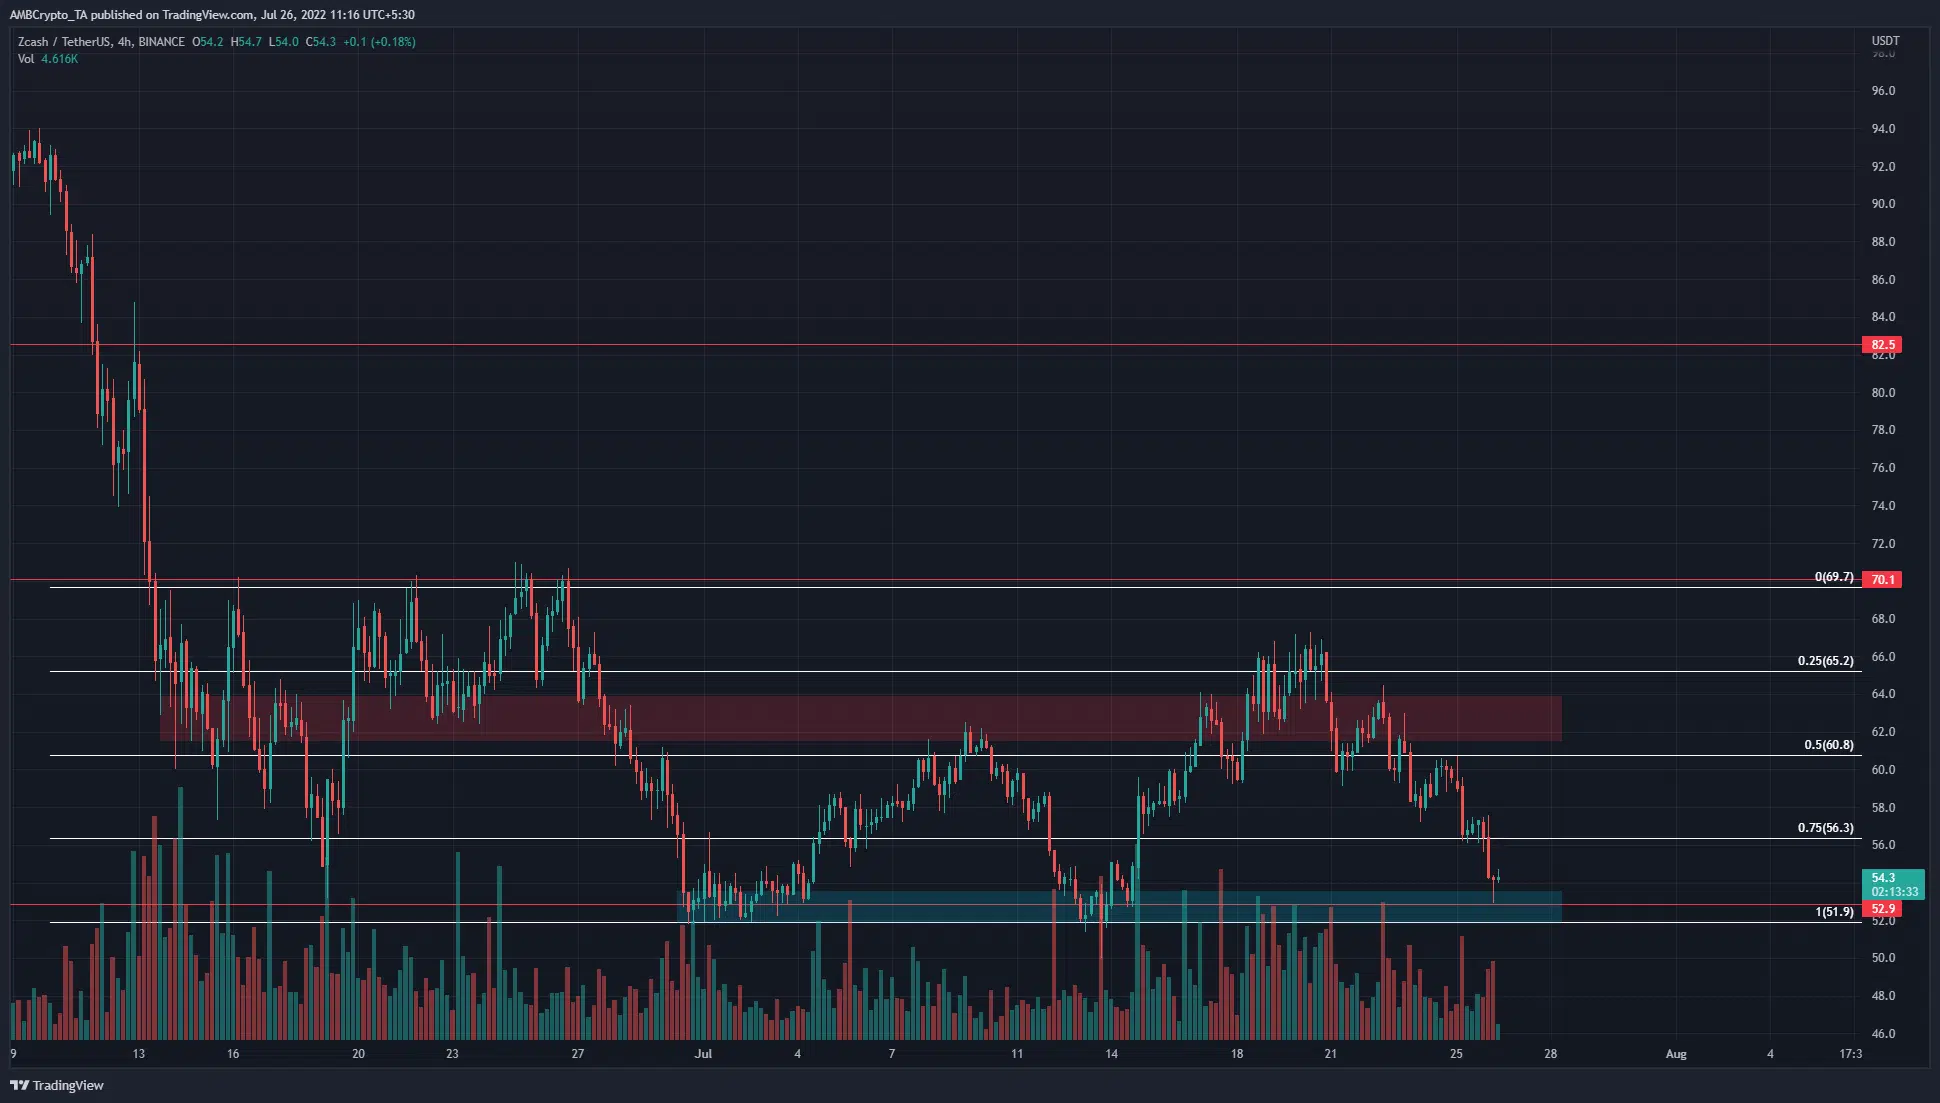
In July, ZEC appeared to offer a good buying opportunity just above the $50 area. After a strong downward move, $52.9 was a longer-term horizontal support level that offered a low-risk buying opportunity.
Inside the range, the mid-range ($60.8) level was a significant level, flanked by $65.2 and $56.3 levels which are also important resistance levels. They represent the 25% and 75% mark of the range.
The 4-hour and lower timeframes had a strongly bearish look to them. The move below $60, and its subsequent retest as resistance, was a development that outlined bearish strength.
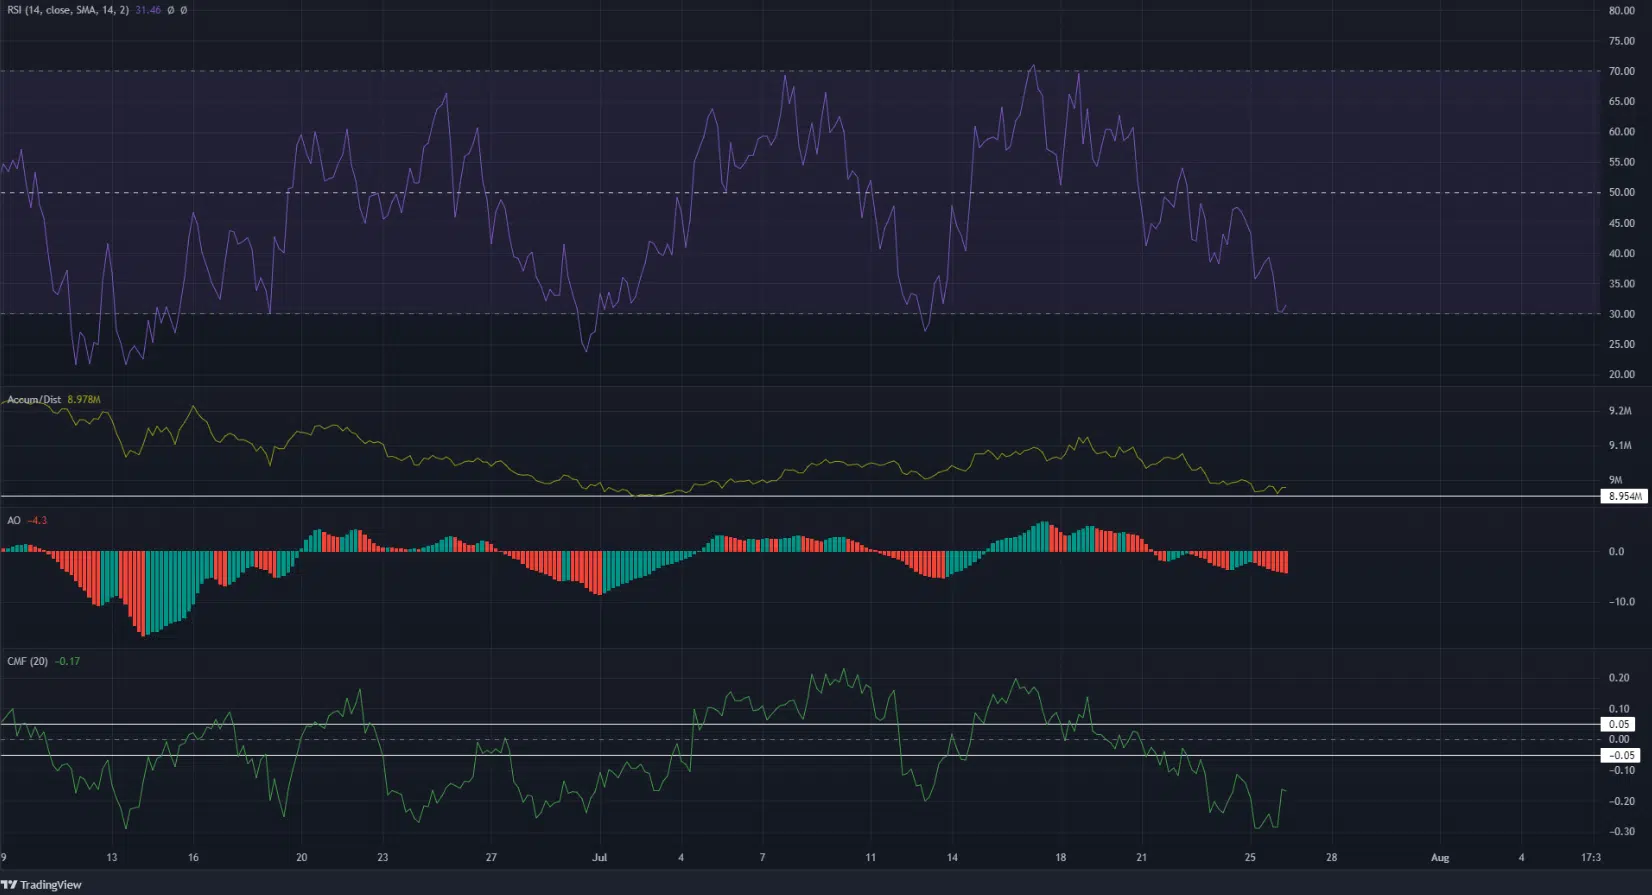
The 4-hour RSI also fell below neutral 50 in recent days and was at 31.4 to show seller dominance. The Awesome Oscillator also registered red bars on its histogram below the zero line, to show acute downward momentum.
The A/D line sat atop a support level from late June when ZEC saw a bounce from the $52 zone. This feat might not be repeated. Caution was advisable, as the CMF also highlighted significant capital flow out of the market.
Conclusion
A revisit of the $52 demand zone appeared to be a good buying opportunity. Yet, Bitcoin was weak on the charts, and a move back below $20k for BTC can not be discounted.
In light of such bearish expectations, it seemed safer to wait or sell Zcash rather than buy a demand zone that has been tested thrice within the past month. Lower timeframe traders can wait for a retest of the $60 or the $56 levels to enter short positions.


