Helium: Binance’s erroneous payouts had these effects on HNT’s performance

Leading crypto exchange Binance, as of 16 September, made a massive blunder that turned out profitable for some users. According to new reports, Binance erroneously paid out about 4.8 million Helium [HNT] tokens to some users. Many of these users took advantage of the situation and sold the alt at a profit.
The mistaken payments resulted from an accounting bug on the exchange, as per reports.
Helium Network has two tokens. These are the HNT token – which the network pays its hotspot hosts. The second is the MOBILE token – paid to the operators of the network’s 5G infrastructure. Although closely linked, these assets are distinct.
On 16 September, Binance erroneously “counted them as one,” – HNT. This mistaken belief caused depositors who sent MOBILE to Binance addresses to receive a corresponding amount of the “more valuable HNT.”
As a result of this error, 4.8 million HNT tokens worth $19 million were sent to users.
How did the HNT react?
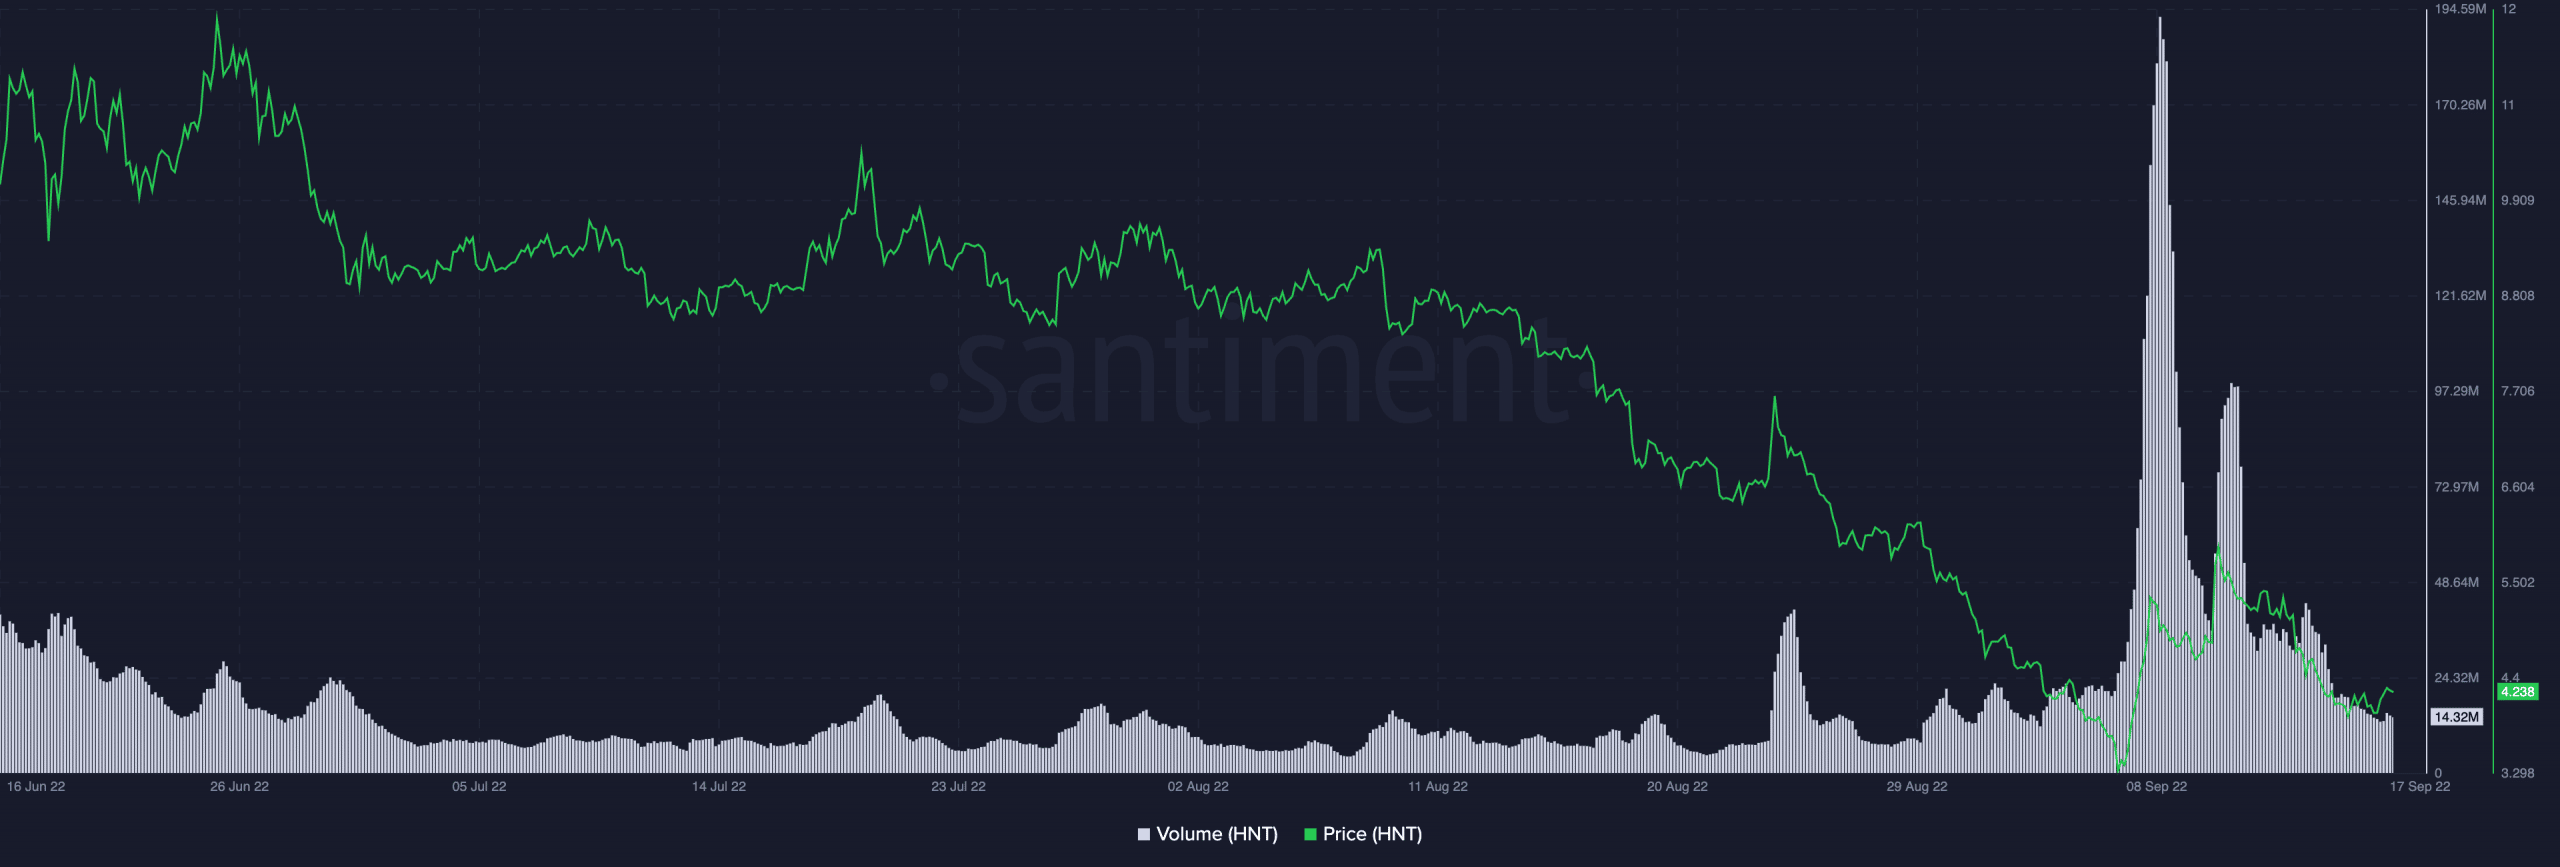
As of this writing, HNT traded at $4.24, data from CoinMarketCap revealed. During the trading session of 16 September, the native token sold for as low as $3.94 per token.
Since the news of the erroneous payments broke, not much price growth or decline has been logged by HNT. In fact, in the last 24 hours, the price of HNT was up by 1%. However, the trading volume within the window period was also down 12%.
According to data from Santiment, the price of HNT dropped by over 135% in the last three months. Within the 90-day period, the asset logged its highest daily trading volume on 7 September, when the price saw temporary relief. However, since then, the asset’s price and trading volume have decreased.
It is business as usual
Down 92% from its all-time high, HNT continued on its nine-month-long decline. Although following the erroneous HNT payments, many users on Binance took to selling the paid put HNT tokens for profit.
Additionally, the asset’s Relative Strength Index (RSI) and Money Flow Index (MFI) remained flat on a daily chart. Albeit, these indicators were positioned in spots suggestive of rallying selling pressure. As of this writing, the RSI and MFI were 39 and 58, respectively.
However, a look at the asset’s Moving Average Convergence Divergence (MACD) revealed an upward intersection of the MACD and the trend line on 8 September. With price marked by green histogram bars since then, the bulls might also be attempting a comeback.


![Bittensor [TAO] tops the AI charts once again, but 3 hurdles loom](https://ambcrypto.com/wp-content/uploads/2025/04/420567A0-9D98-4B5B-9FFF-2B4D7BD2D98D-400x240.webp)
