LUNC traders can look to trade with the trend as a zone of resistance looms ahead

Disclaimer: The findings of the following analysis are the sole opinions of the writer and should not be considered investment advice.
Terra Classic [LUNC] saw huge volatility on the charts in September. It posted gains of close to 150% in the first week of September. In the following week, the price retraced a good portion of this move upward. What does LUNC hold over the next week?
LUNC- 12-Hour Chart
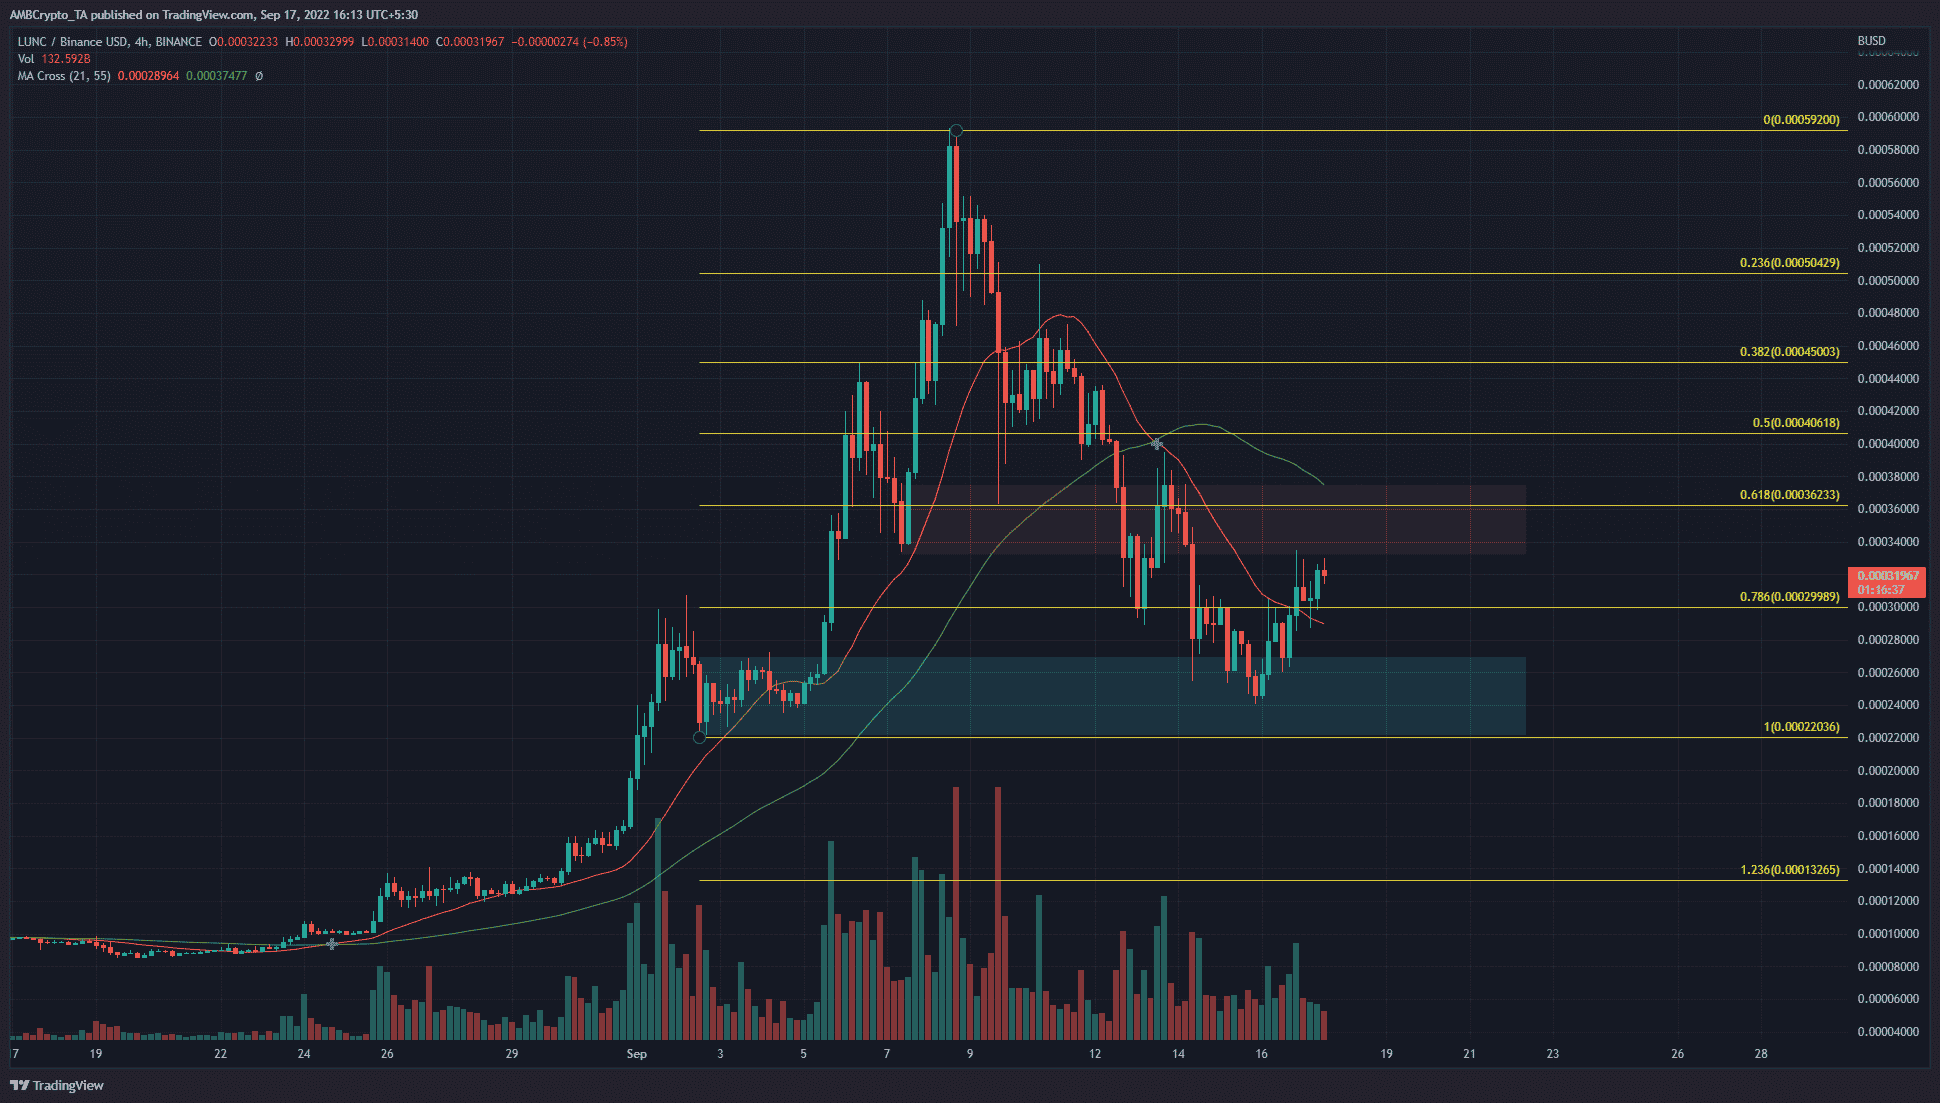
A set of Fibonacci retracement levels were drawn for LUNC’s skyward surge in September. The 78.6% retracement level at $0.0003 acted as support earlier this week but succumbed to the selling pressure. Over the past day’s trading, this level has once more been flipped to support.
The bullish order block (cyan box) in the $0.00024 region saw a decent reaction in recent days as the price bounced 30% from the lows. However, it fast approached a zone of resistance at the 61.8% retracement level. In the first week of September, a bullish order block formed which saw LUNC rapidly rise from $0.00034 to $0.00059.
This same order block has now been flipped to resistance, and it was likely to act as a seller’s stronghold once again. Therefore, selling opportunity could arise over the next few days if Terra Classic continued to post gains toward $0.00036.
Rationale
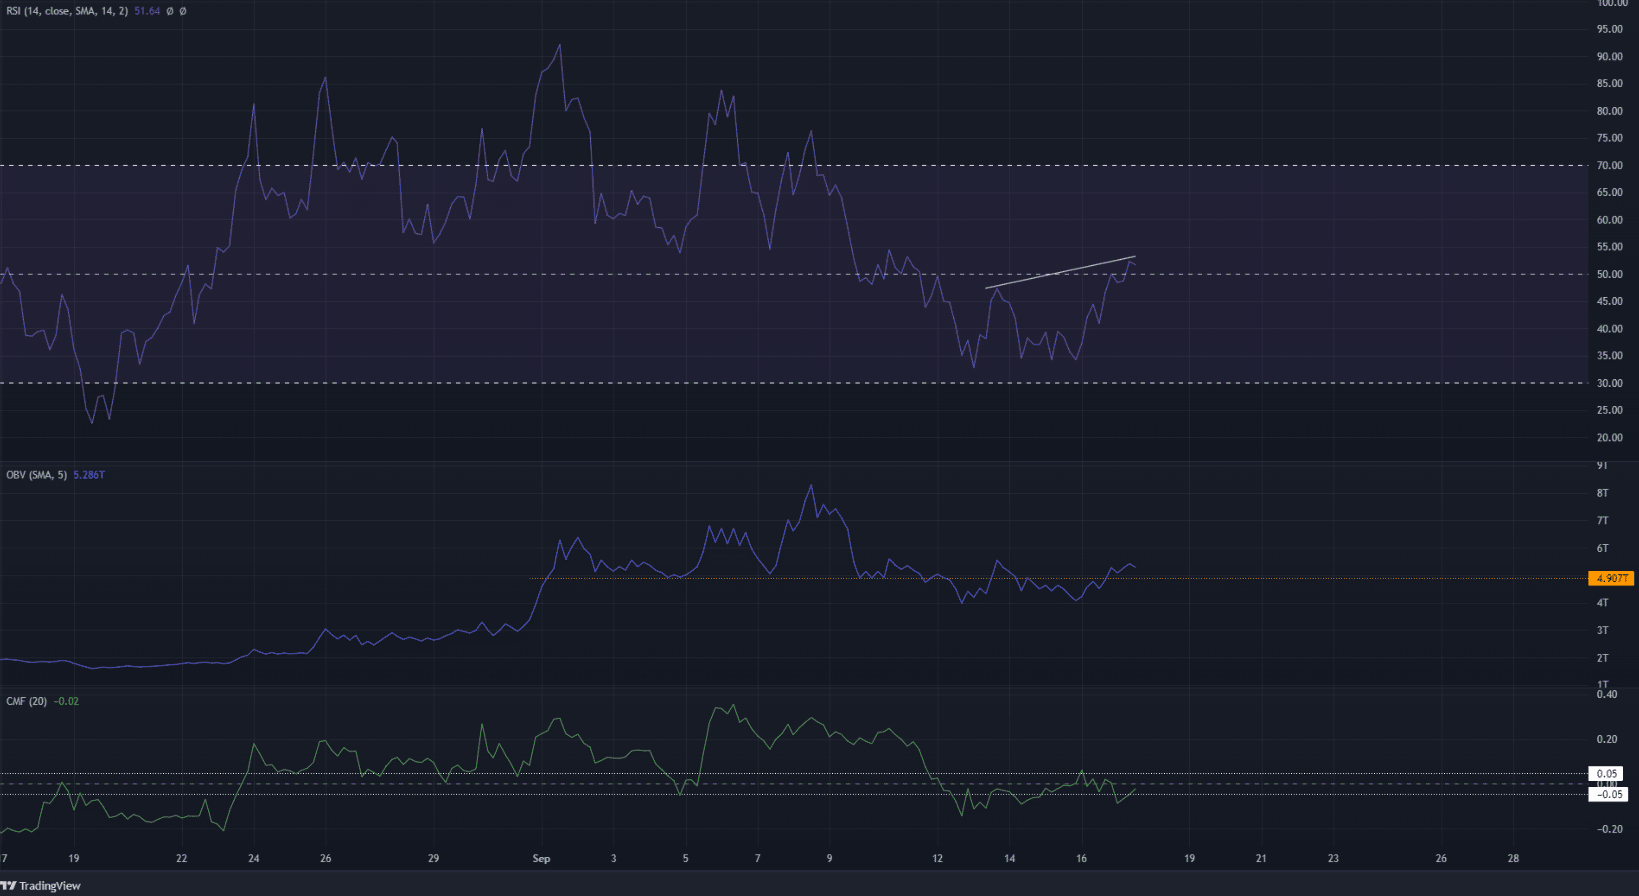
The indicators did not show a bullish picture either. It was true that the H4 Relative Strength Index (RSI) managed to climb back above neutral 50. Yet, in doing so, it formed a hidden bearish divergence. The price has made a lower high while the momentum indicator formed a higher high. This development could see the price react bearishly in the next few days.
The On-Balance Volume (OBV) also rose above a support level from early September, but only barely so. It has been relatively flat over the past week, even though the price saw a sharp decline. This suggested that selling pressure was not as heavy as expected, and recovery was a possibility.
The Chaikin Money Flow (CMF) also stayed in neutral territory over the past week, to once again highlight the lack of significant capital flow into or out of the market.
Conclusion
The price action showed there was a strong possibility of a rejection at $0.00036. The lack of selling volume in the past week suggested a recovery could be possible. Until LUNC can climb past the $0.00036 level and flip it to support, the bias would remain bearish.


