How MATIC buyers can leverage this setup to remain profitable

- MATIC is witnessing a bearish pattern on the daily timeframe
- Key metrics marked a plunge, but Open Interest across exchanges showed a positive sign
Since its mid-June lift-off, Polygon [MATIC] bulls have recovered losses while facing a barrier at its nine-month trendline resistance (white, dashed). The resulting buying comeback propelled a retest of the 200 EMA (green) before an expected pullback.
Here’s AMBCrypto’s Price Prediction for Polygon [MATIC] for 2023-24
The altcoin has now entered a relatively low volatility phase near its EMAs as the sellers aim to inflict a reversal from the trendline resistance. MATIC could likely see a dull phase given the current setup of a bearish pattern.
At press time, MATIC was trading at $0.8406.
MATIC formed a bearish pattern at its resistance level
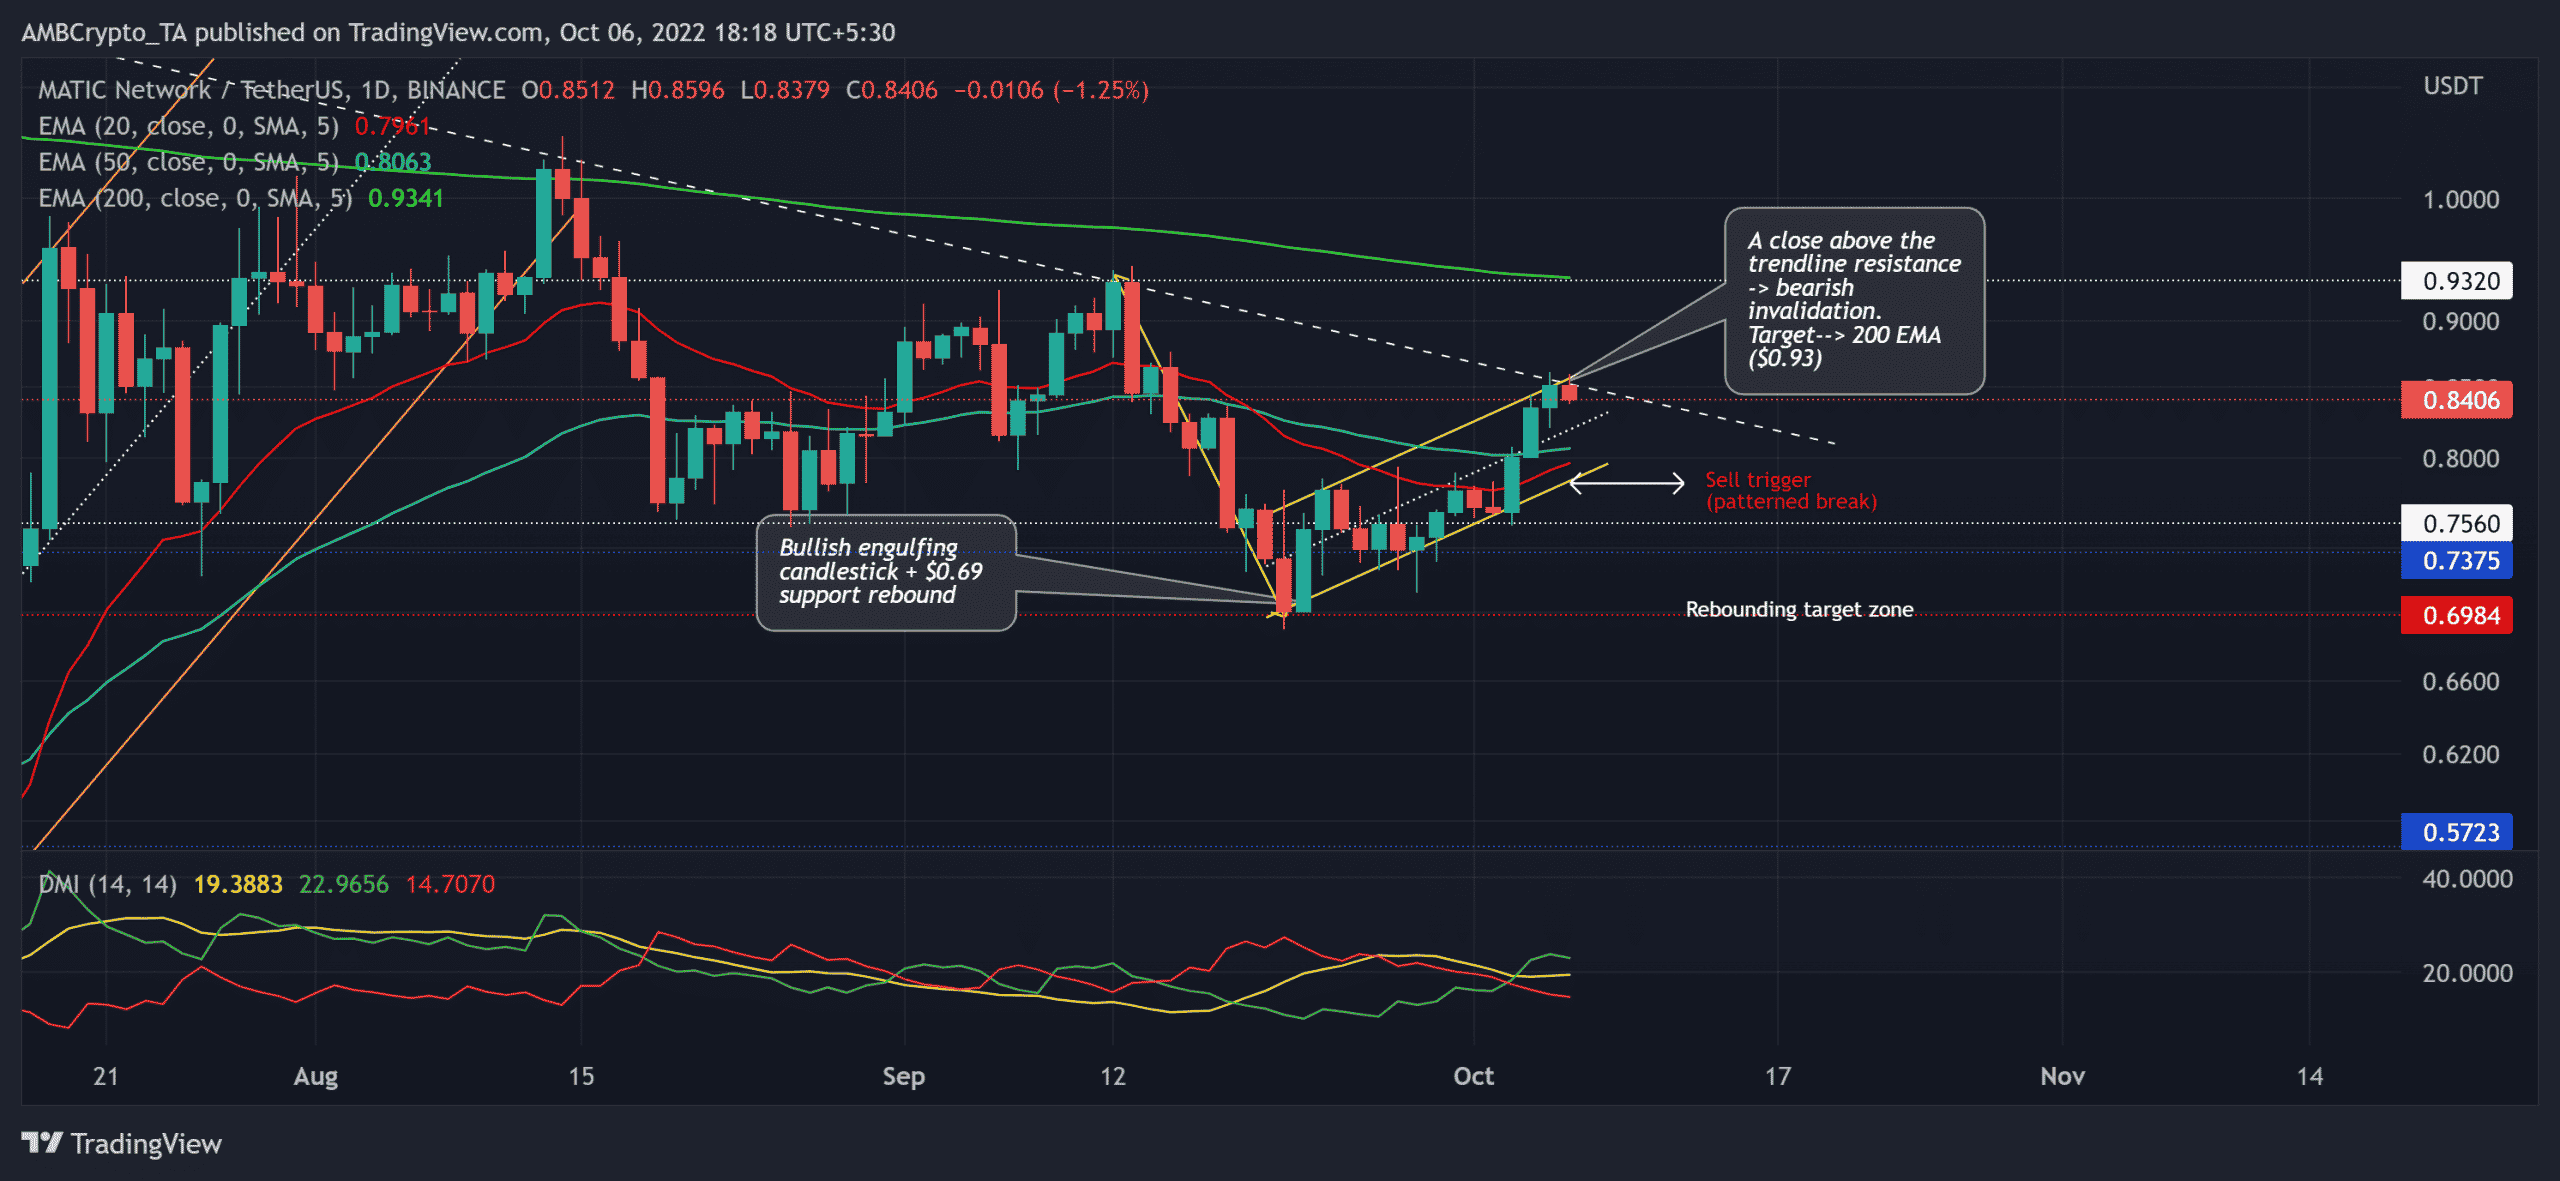
The previous ascending channel breakout aided MATIC bulls to breach the $0.7-$0.75 range and flip it to support. Since then, this range has supported MATIC’s retracement over the two months.
After rebounding from the 200 EMA resistance barrier, the alt struggled to pull off a robust buying rally above its trendline resistance. Moreover, the recent bearish crossover on the 20 EMA (red) and the 50 EMA (cyan) reaffirmed the near-term selling edge.
With these EMAs now looking north, buyers could aim to find grounds to bounce back from them. In the meantime, MATIC formed a bearish-flag-like structure, one that could reignite some selling pressure.
A close below the pattern or the $0.78-level would position MATIC for a near-term downside. In this case, the potential target would lie in the $0.69 baseline.
An eventual close above the long-term trendline resistance can invalidate the default bearish tendencies. The bulls must ramp up the buying volumes to sustain a close above the immediate resistance range. In these circumstances, the buyers would look to retest the 200 EMA before a likely reversal.
The Directional Movement Index (DMI) hinted at a slight bullish edge, but the ADX depicted a weak directional trend for MATIC.
Key metrics marked a slight plunge
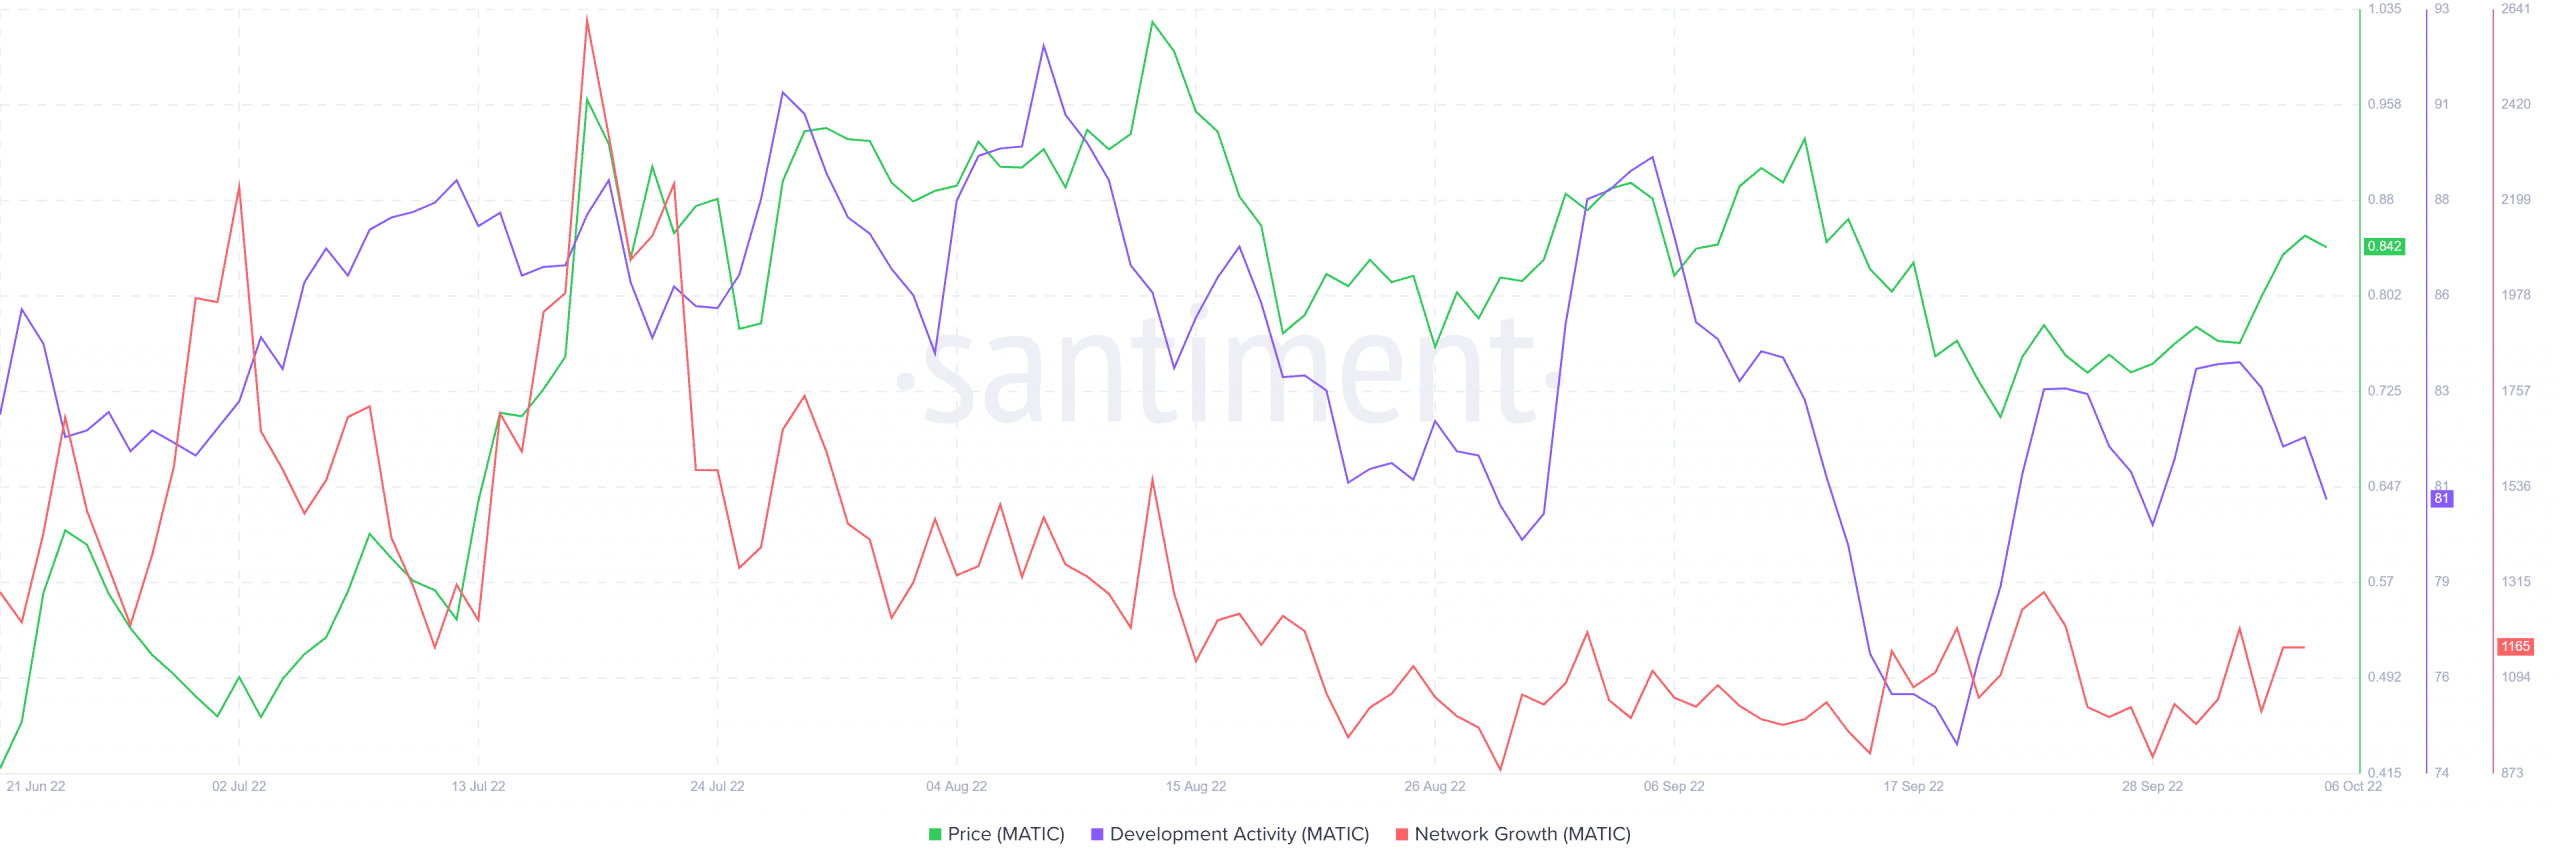
Since early September, MATIC’s development activity has been gradually declining. Additionally, its Network growth also took a toll as it saw a decline in the number of new addresses. These readings unveiled the alt’s decreasing traction over the past month. An inability of the buyers to change this perception could fuel near-term bearish inclinations.
On the other hand, MATIC Open Interest increased by nearly 1.9% across all exchanges in the past 24 hours. Correspondingly, the price was up by around 2% during this time. This hinted at a healthy increase in price. Nonetheless, buyers should look for the triggers and targets mentioned above.
Last but not the least, investors/traders must keep a close eye on Bitcoin’s movement as MATIC shares an 89% 30-day correlation with the king coin.