Ethena’s 13% price rally – Here’s how all these gains were wiped out!
Rising ENA on exchanges, bearish long-term trend, and rejection from $0.10 meant traders can brace themselves for another price leg southward.

Ethena [ENA] made a strong start to this week of trading, rallying rapidly from $0.0870 to $0.0985. This 13.22% move took only 12 hours to make, and the strong start to Monday, June 22, appeared to give bulls reason for optimism.
Unfortunately for the buyers, this was not to be.
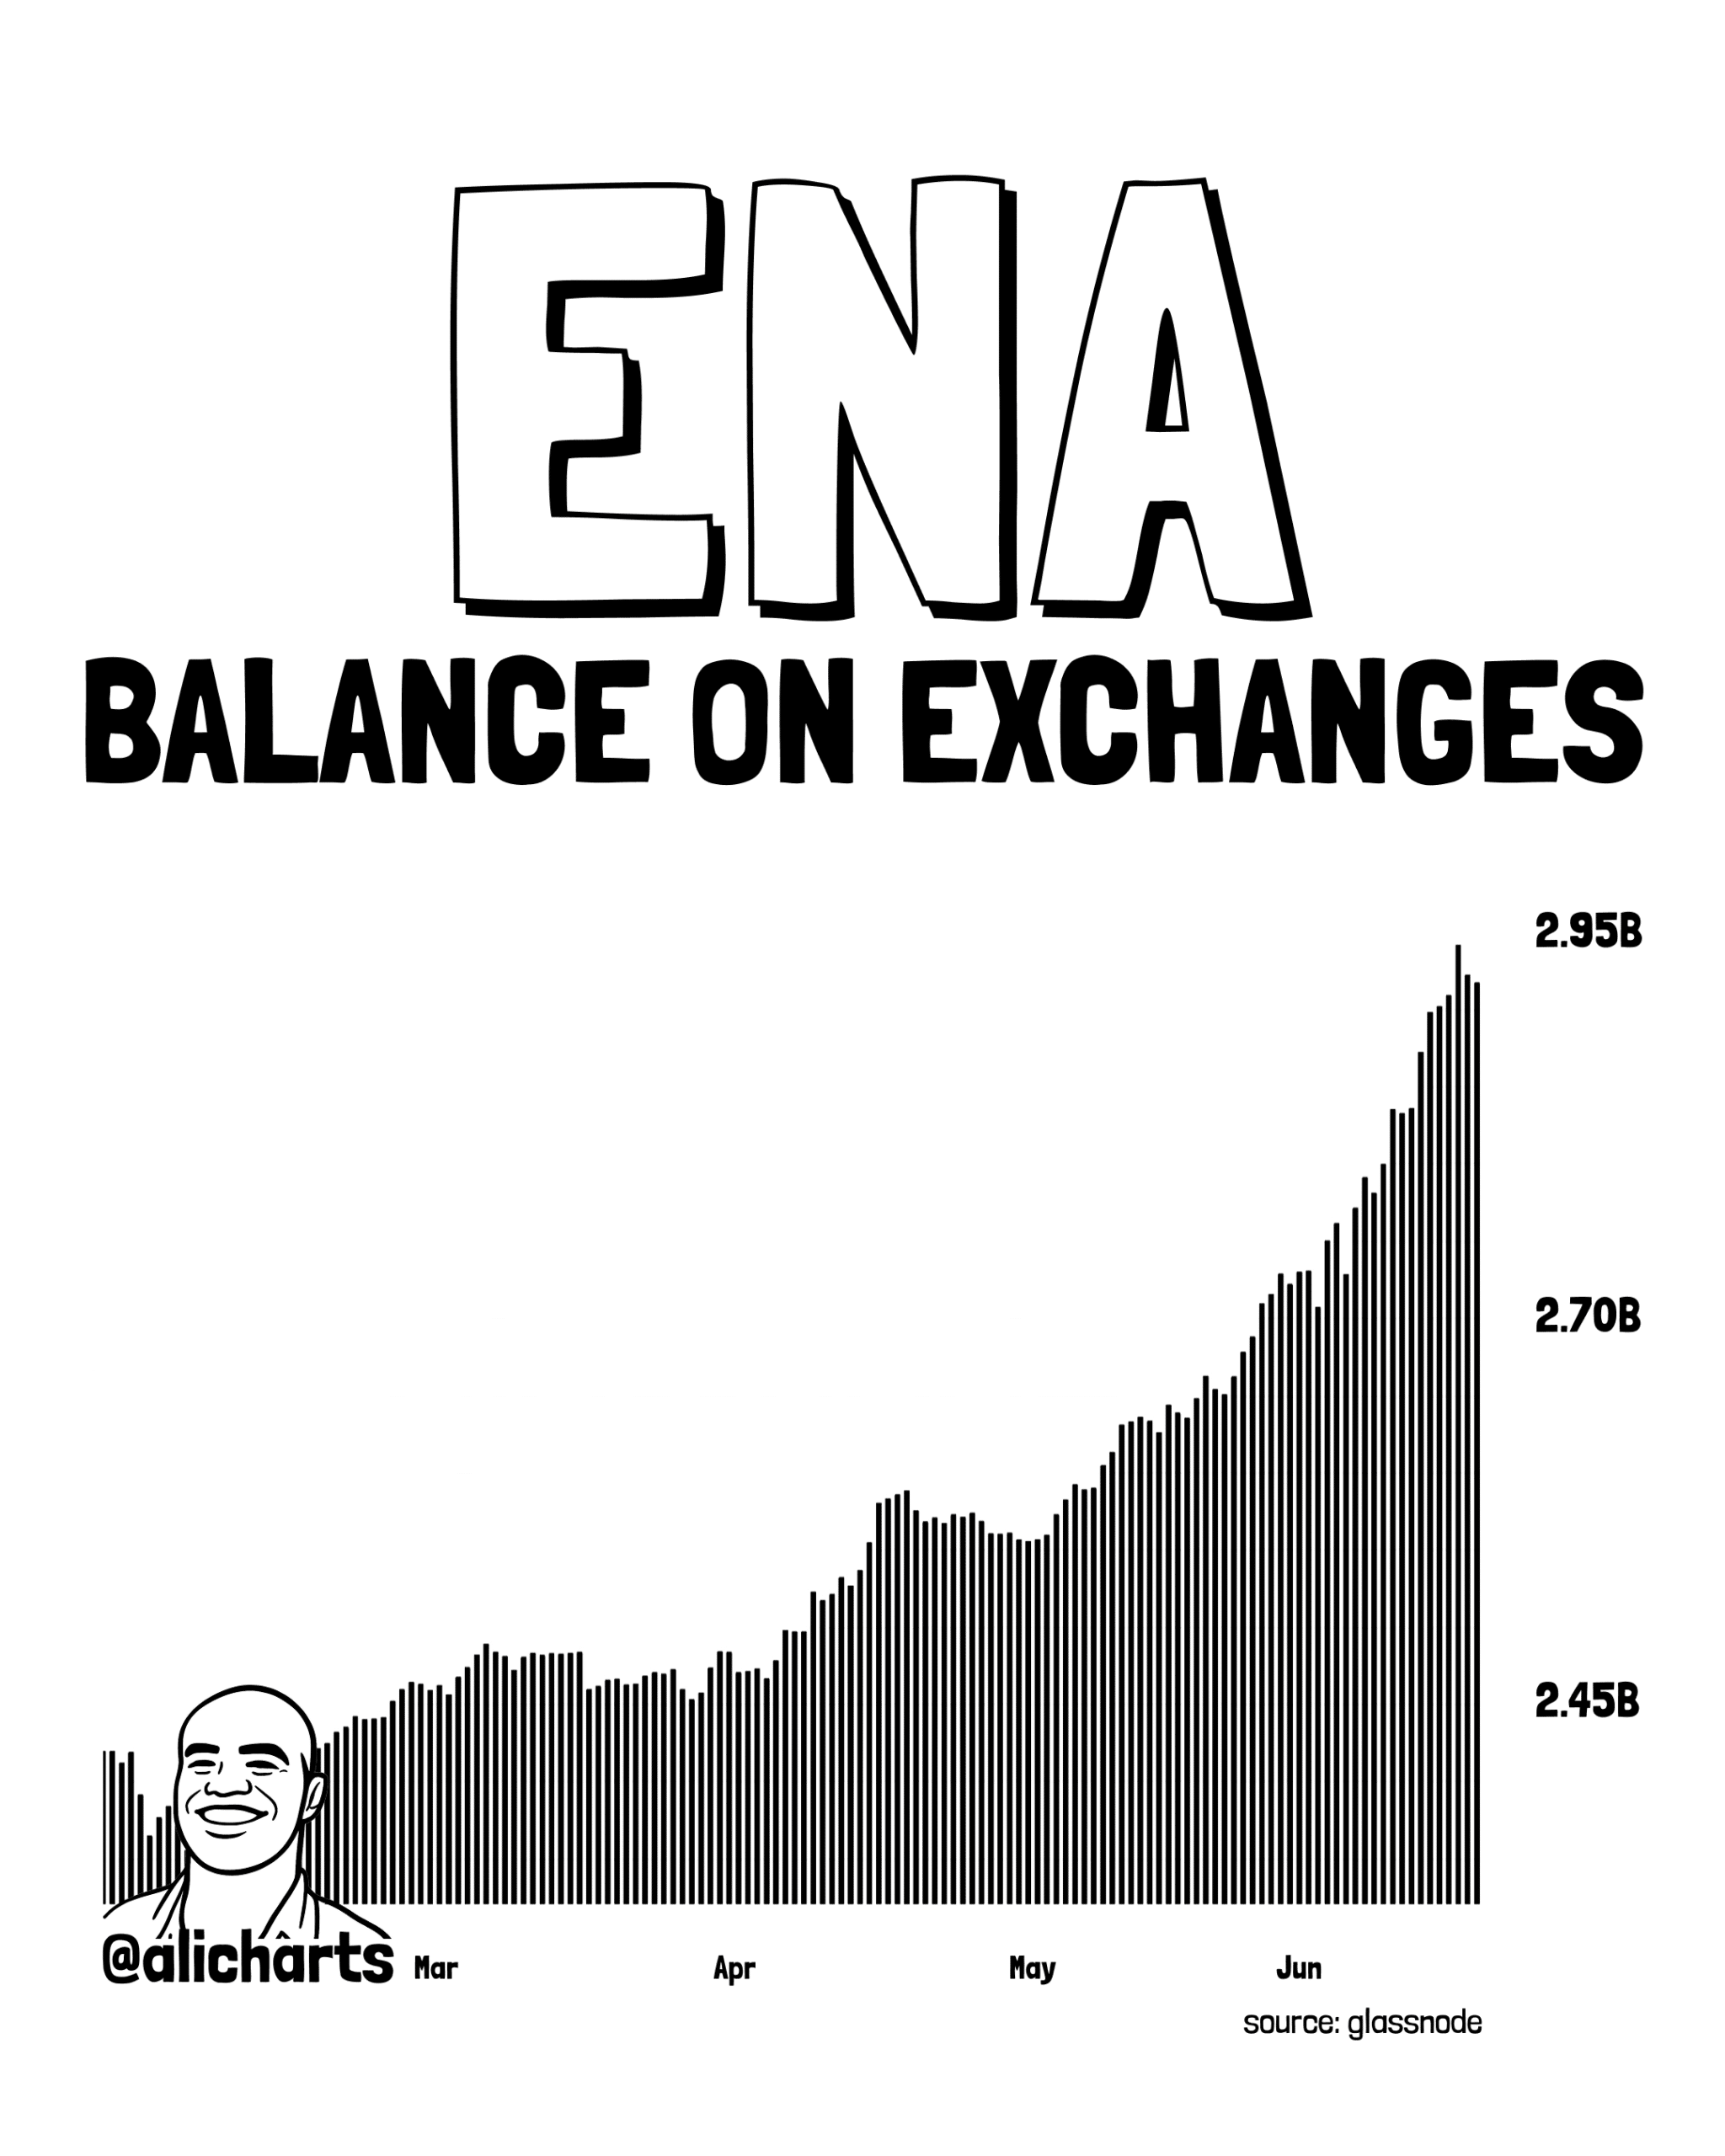
The altcoin has erased all these short-term gains and was trading at $0.0858 at the time of writing. In a post on X, crypto analyst Ali Martinez pointed out that the ENA balance on exchanges has been rising. Over 300 million tokens have entered trading platforms over the past month.
This betrayed an intent to sell from holders. Monday’s price spike was likely only a brief bounce before the downtrend’s continuation.
Putting the ENA trends together
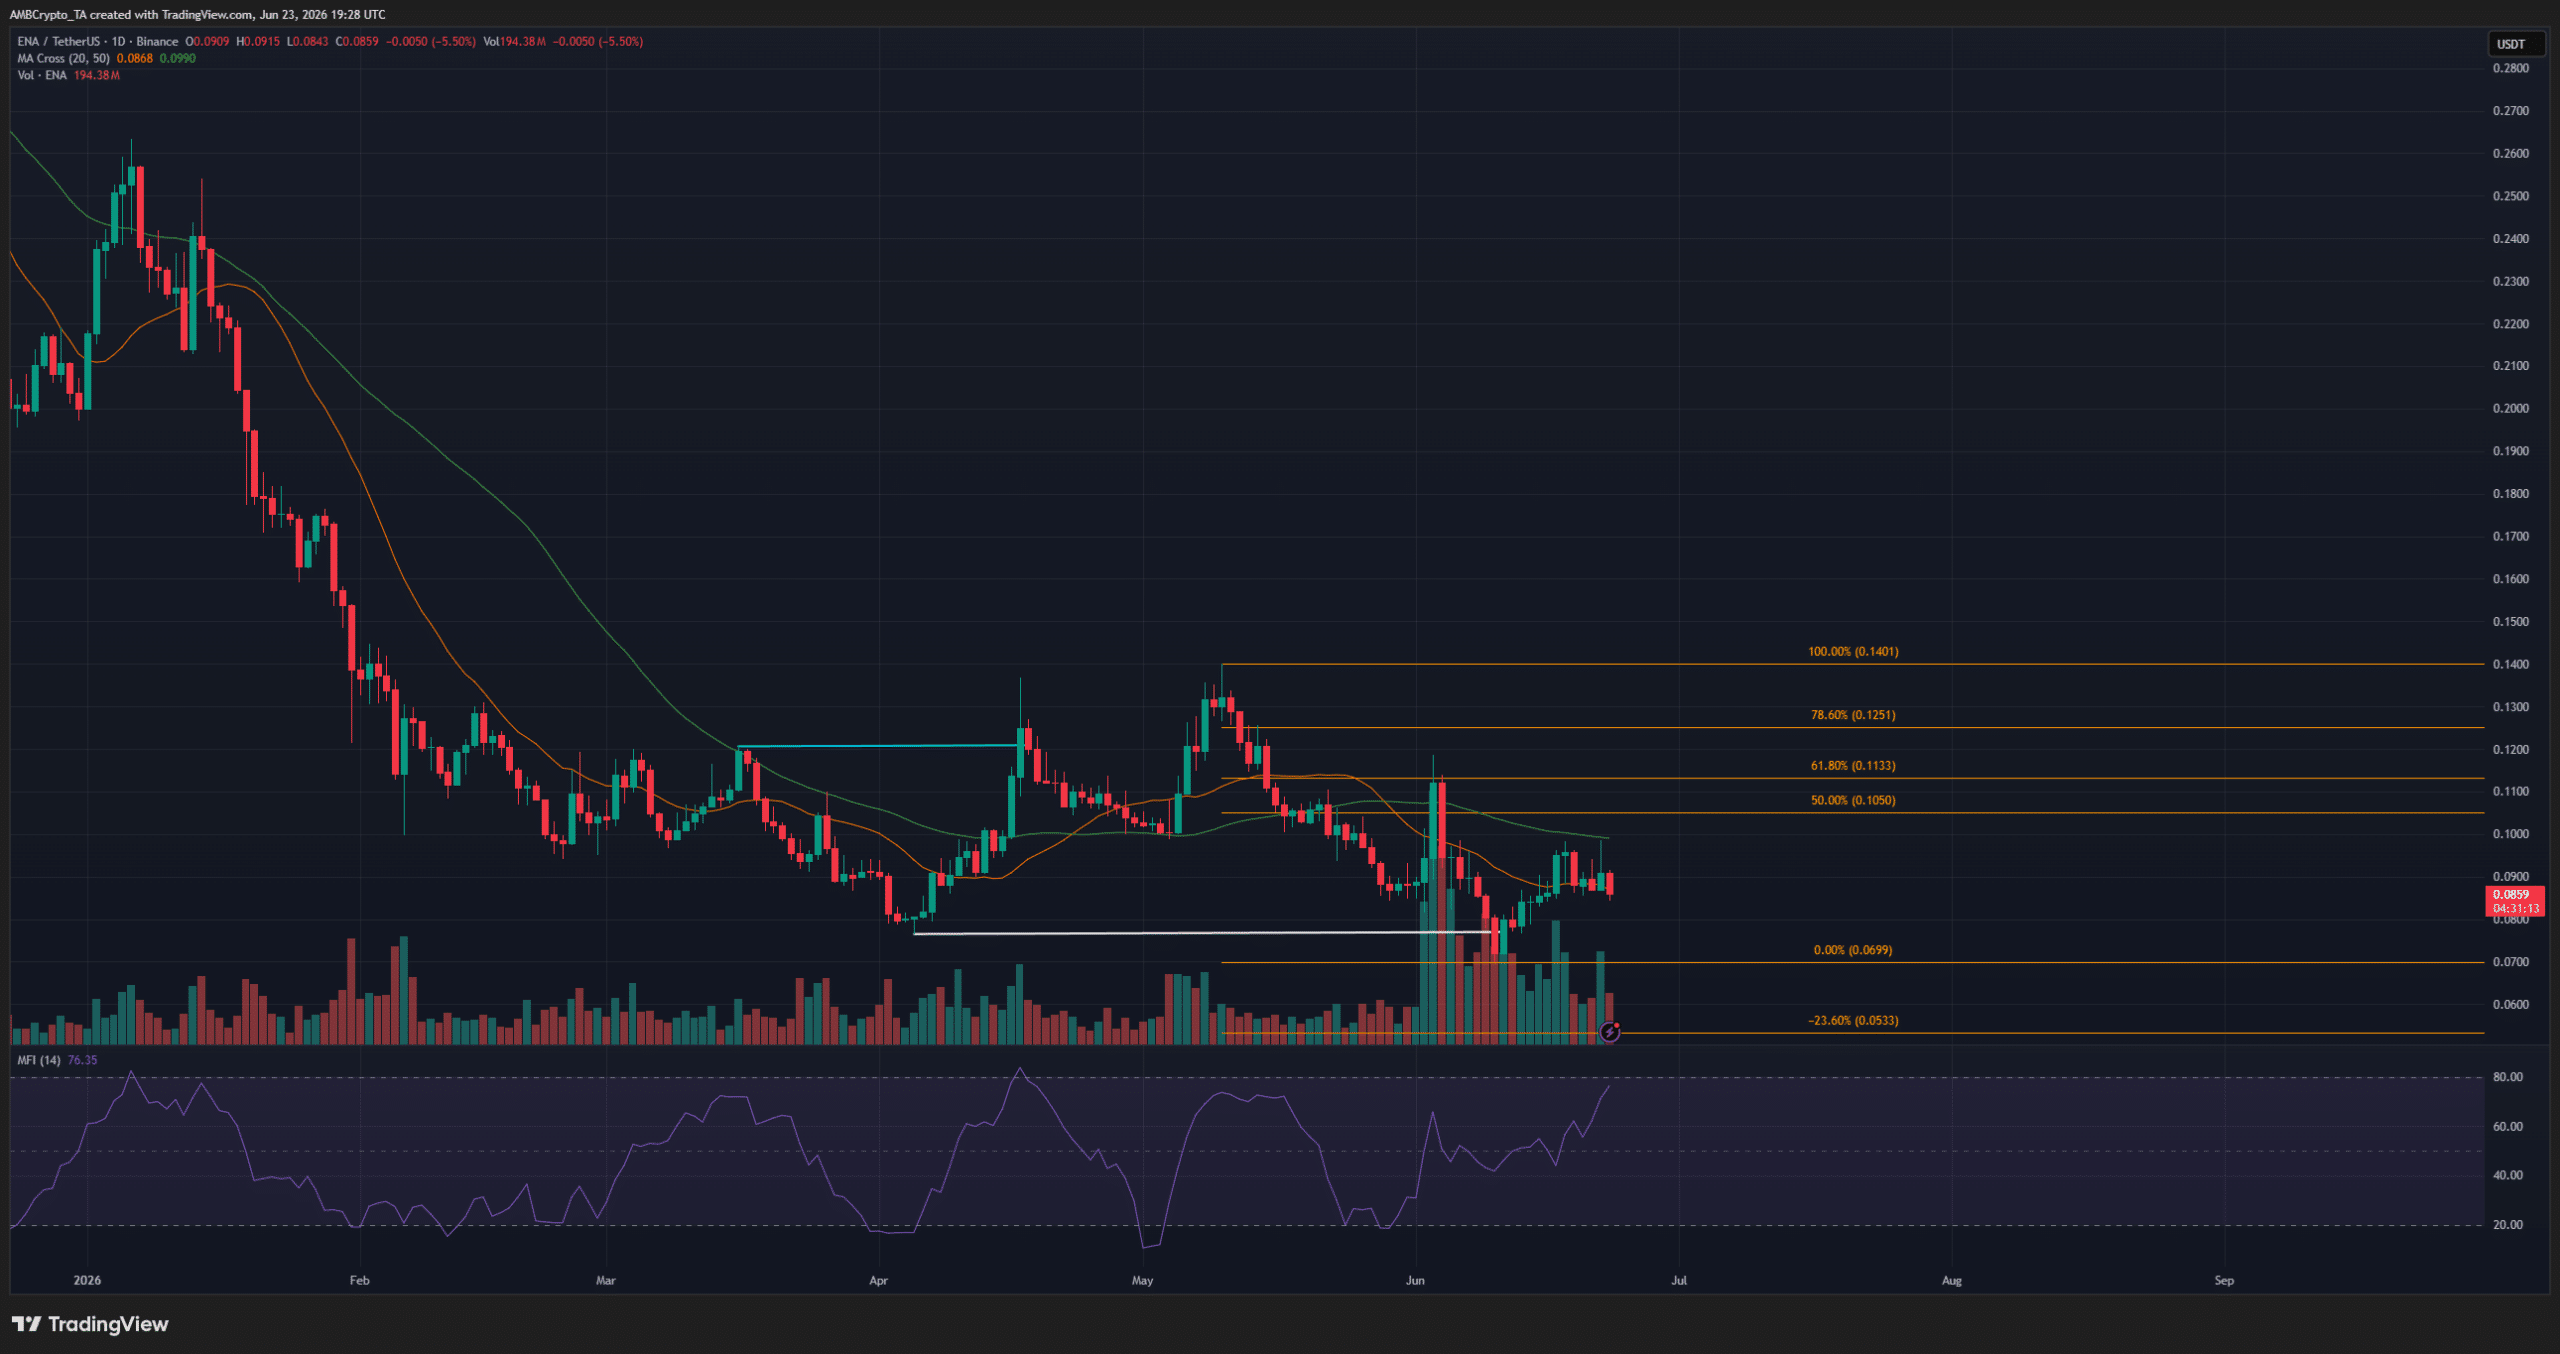
The Ethena swing structure was slightly complicated. After making a low at $0.0765 in early April, Ethena bulls forced prices to climb back above the $0.1206 swing high [cyan] to shift the structure bullishly. However, they were unable to establish a new higher high.
Instead, the crypto market came under severe selling pressure, ENA included. The $0.0765 low was breached [white], shifting the structure bearishly.
The moving averages confirmed a bullish momentum over the past three weeks, though the MFI was climbing toward the overbought 80 mark.
Traders’ call to action- Sell
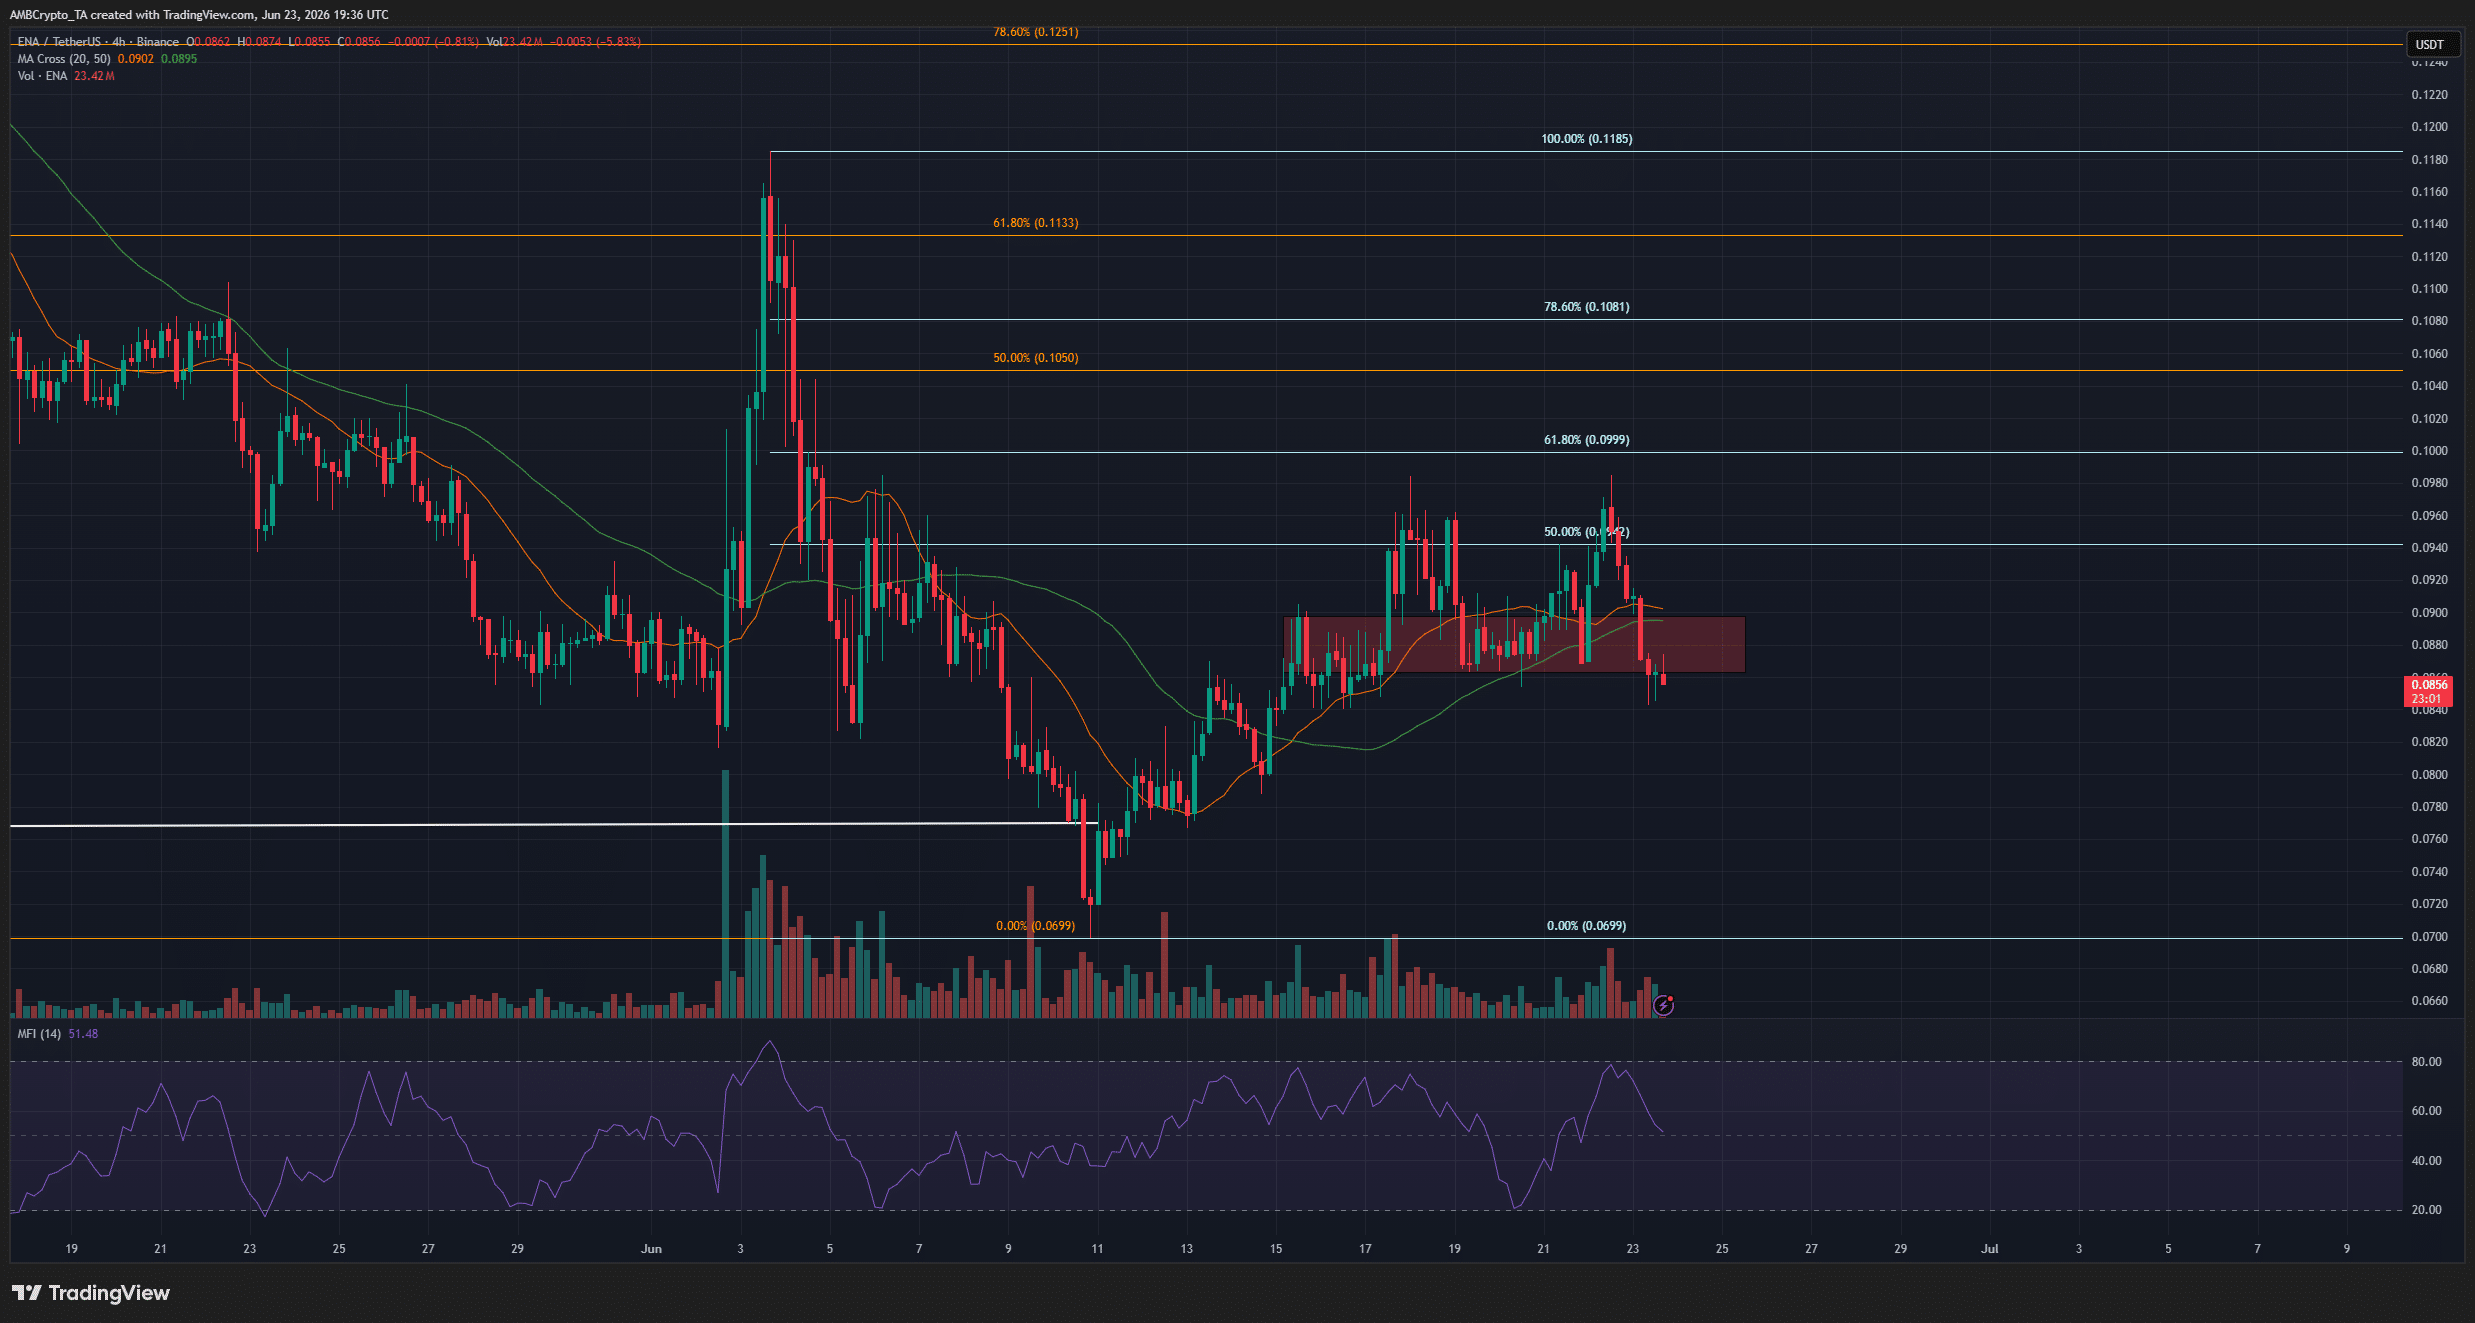
The 4-hour chart made it clear that the recent gains were part of a relief rally. It was unable to climb to the 78.6% retracement level at $0.1081, stopping short at the psychological round-number resistance at $0.10 instead.
At the time of writing, the $0.086-$0.090 area has also been shifted from support to resistance. Further price drops appear likely.
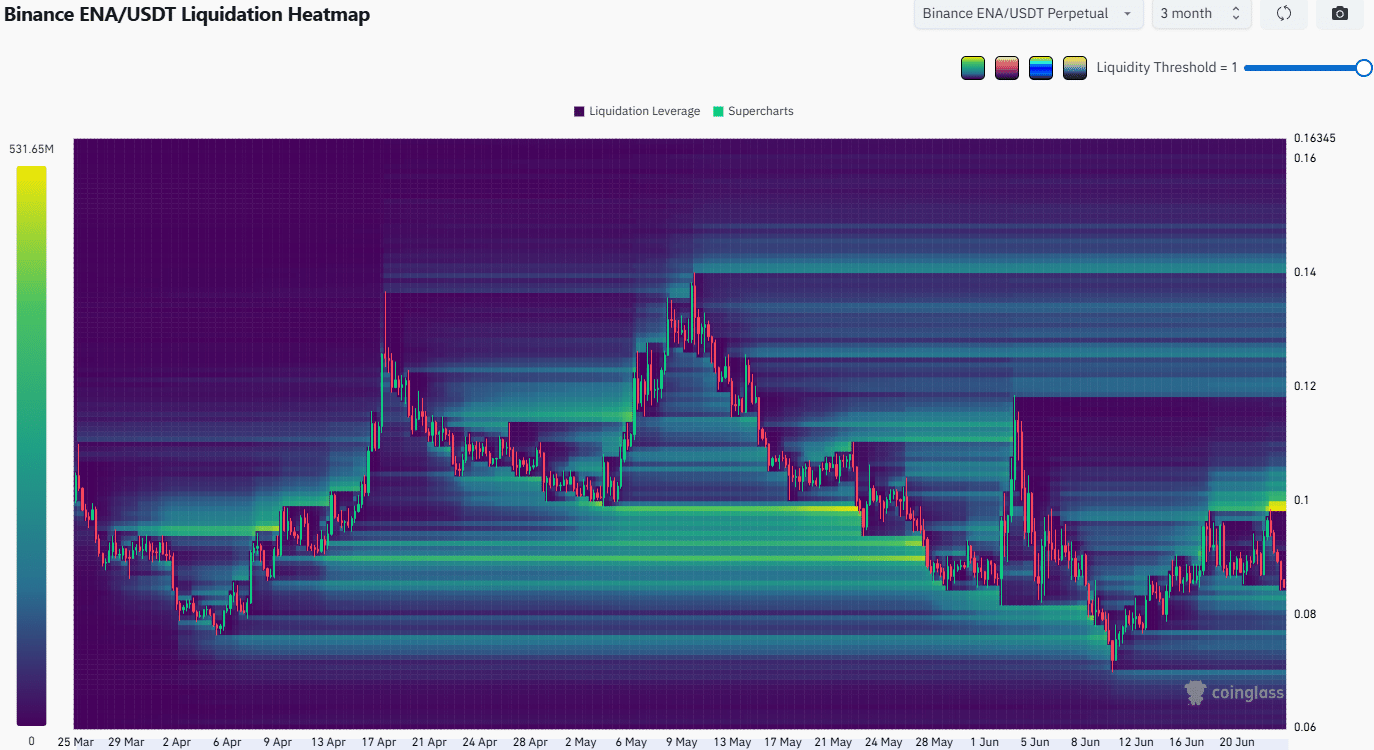
The liquidation heatmap also highlighted the cluster of short liquidations around the $0.10 area. A part of this liquidity pocket was tested before the recent downturn.
The combination of rising ENA on exchanges, the bearish long-term trend, and the rejection from the $0.10 round-number resistance meant traders can brace themselves for another price leg southward.
Final Summary
- The rising onchain activity and a short-term bullish price spike were not enough to overturn the longer-term ENA trend.
- The $0.10 psychological level has been stoutly defended, and the bears were back in control.


