Fantom: The ‘but’ in FTM’s recent rally and why traders should maintain caution

- Fantom has a new proposal to reduce its current burn rate
- FTM’s price has rallied by 30% in the last week
Fantom’s [FTM] witnessed a 30% rally in the last seven days following the publication of the proposal to reduce the network’s current burn rate.
Read Fantom’s [FTM] Price Prediction 2023-24
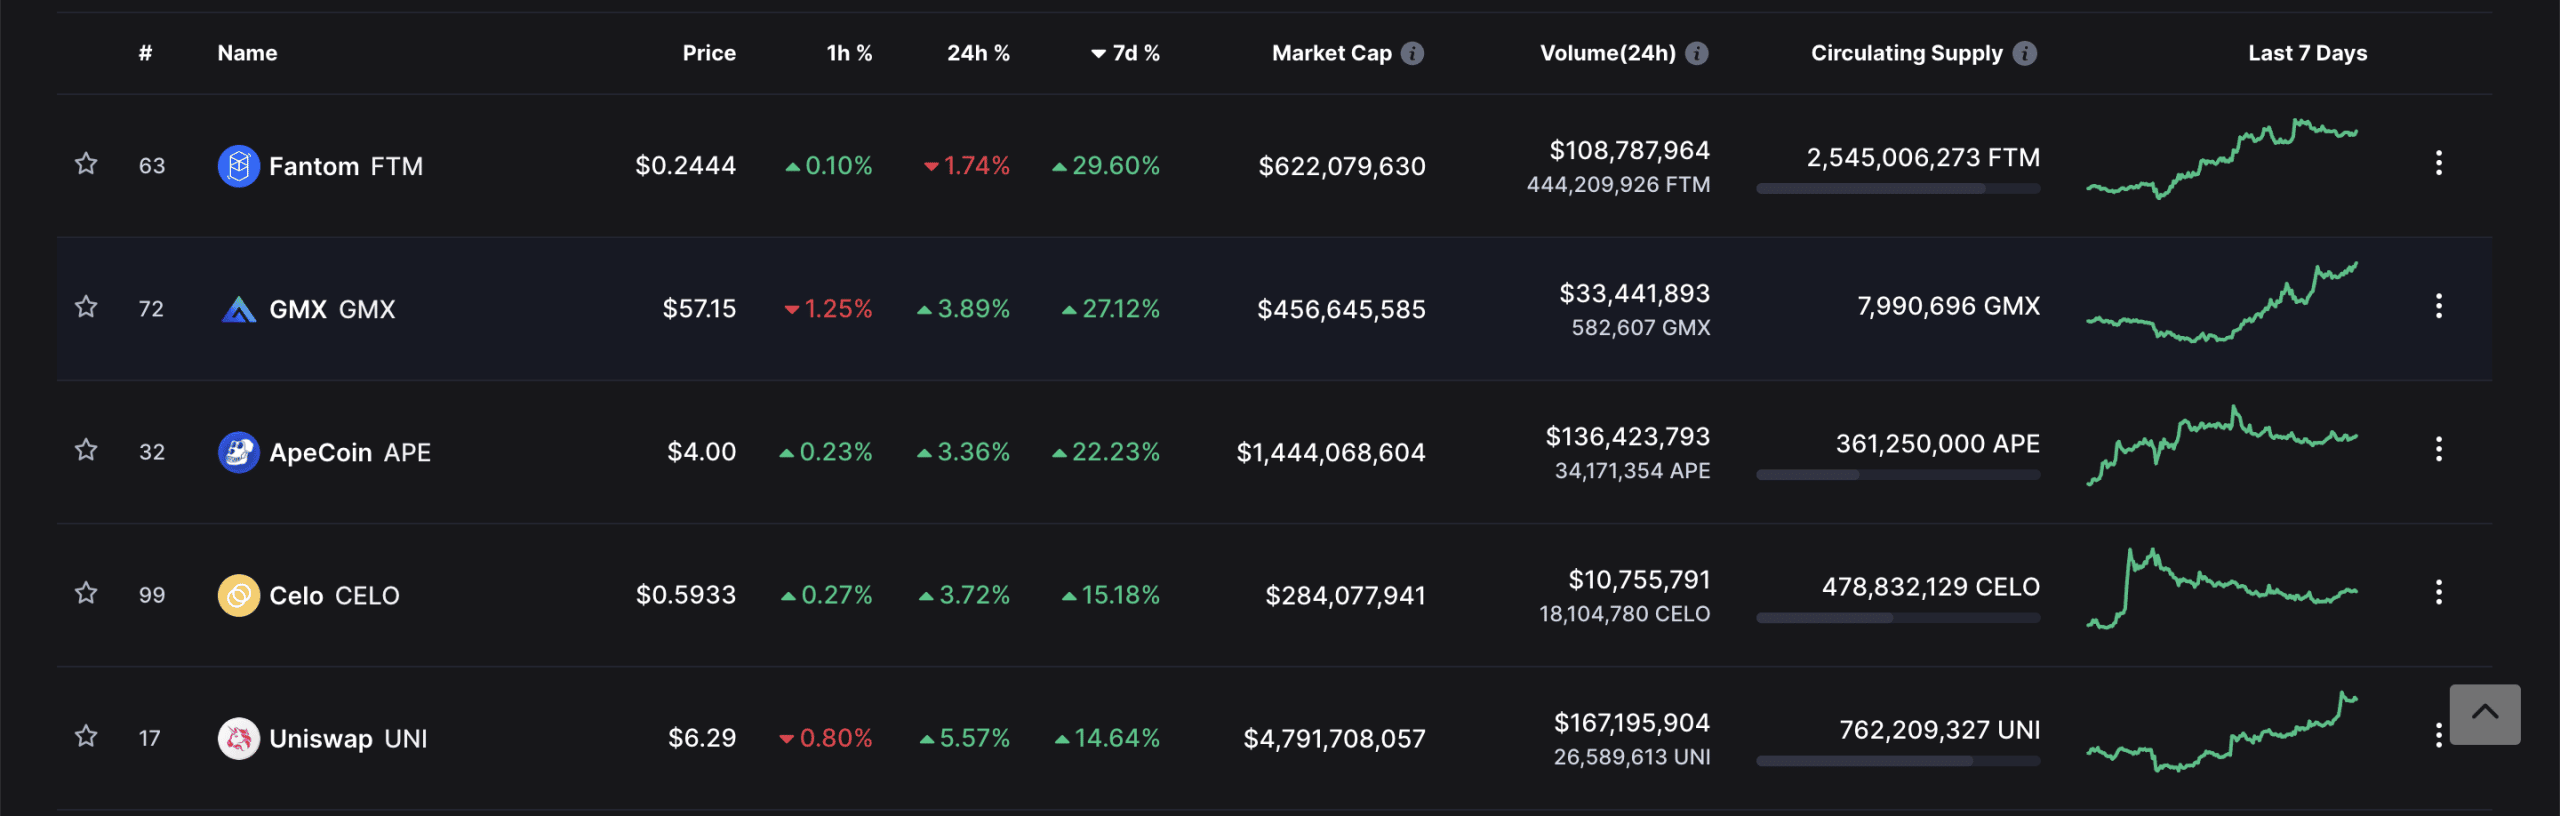
Per data from CoinMarketCap, FTM traded at $0.2449 at press time. A week ago, the altcoin exchanged hands at $0.19. The 30% rally in price put FTM above other assets such as GMX, APE, CELO, and UNI, which rose by 27.12%, 22.23%, 15.18%, and 14.64%, respectively.
Through its new governance proposal, titled “dApp Gas Monetization Program,” Fantom sought to reduce its current burn rate. It planned to do so by redirecting its fee directly to the decentralized applications (dApps) housed within the network.
According to the proposal, if the same is passed, the “implementation will reduce Fantom’s burn rate of 20% to 5% and redirect this 15% reduction towards gas monetization.”
Furthermore, the gas monetization “will reward high-quality dApps, retain talented creators, and support Fantom’s network infrastructure.”
What Fantom has in store
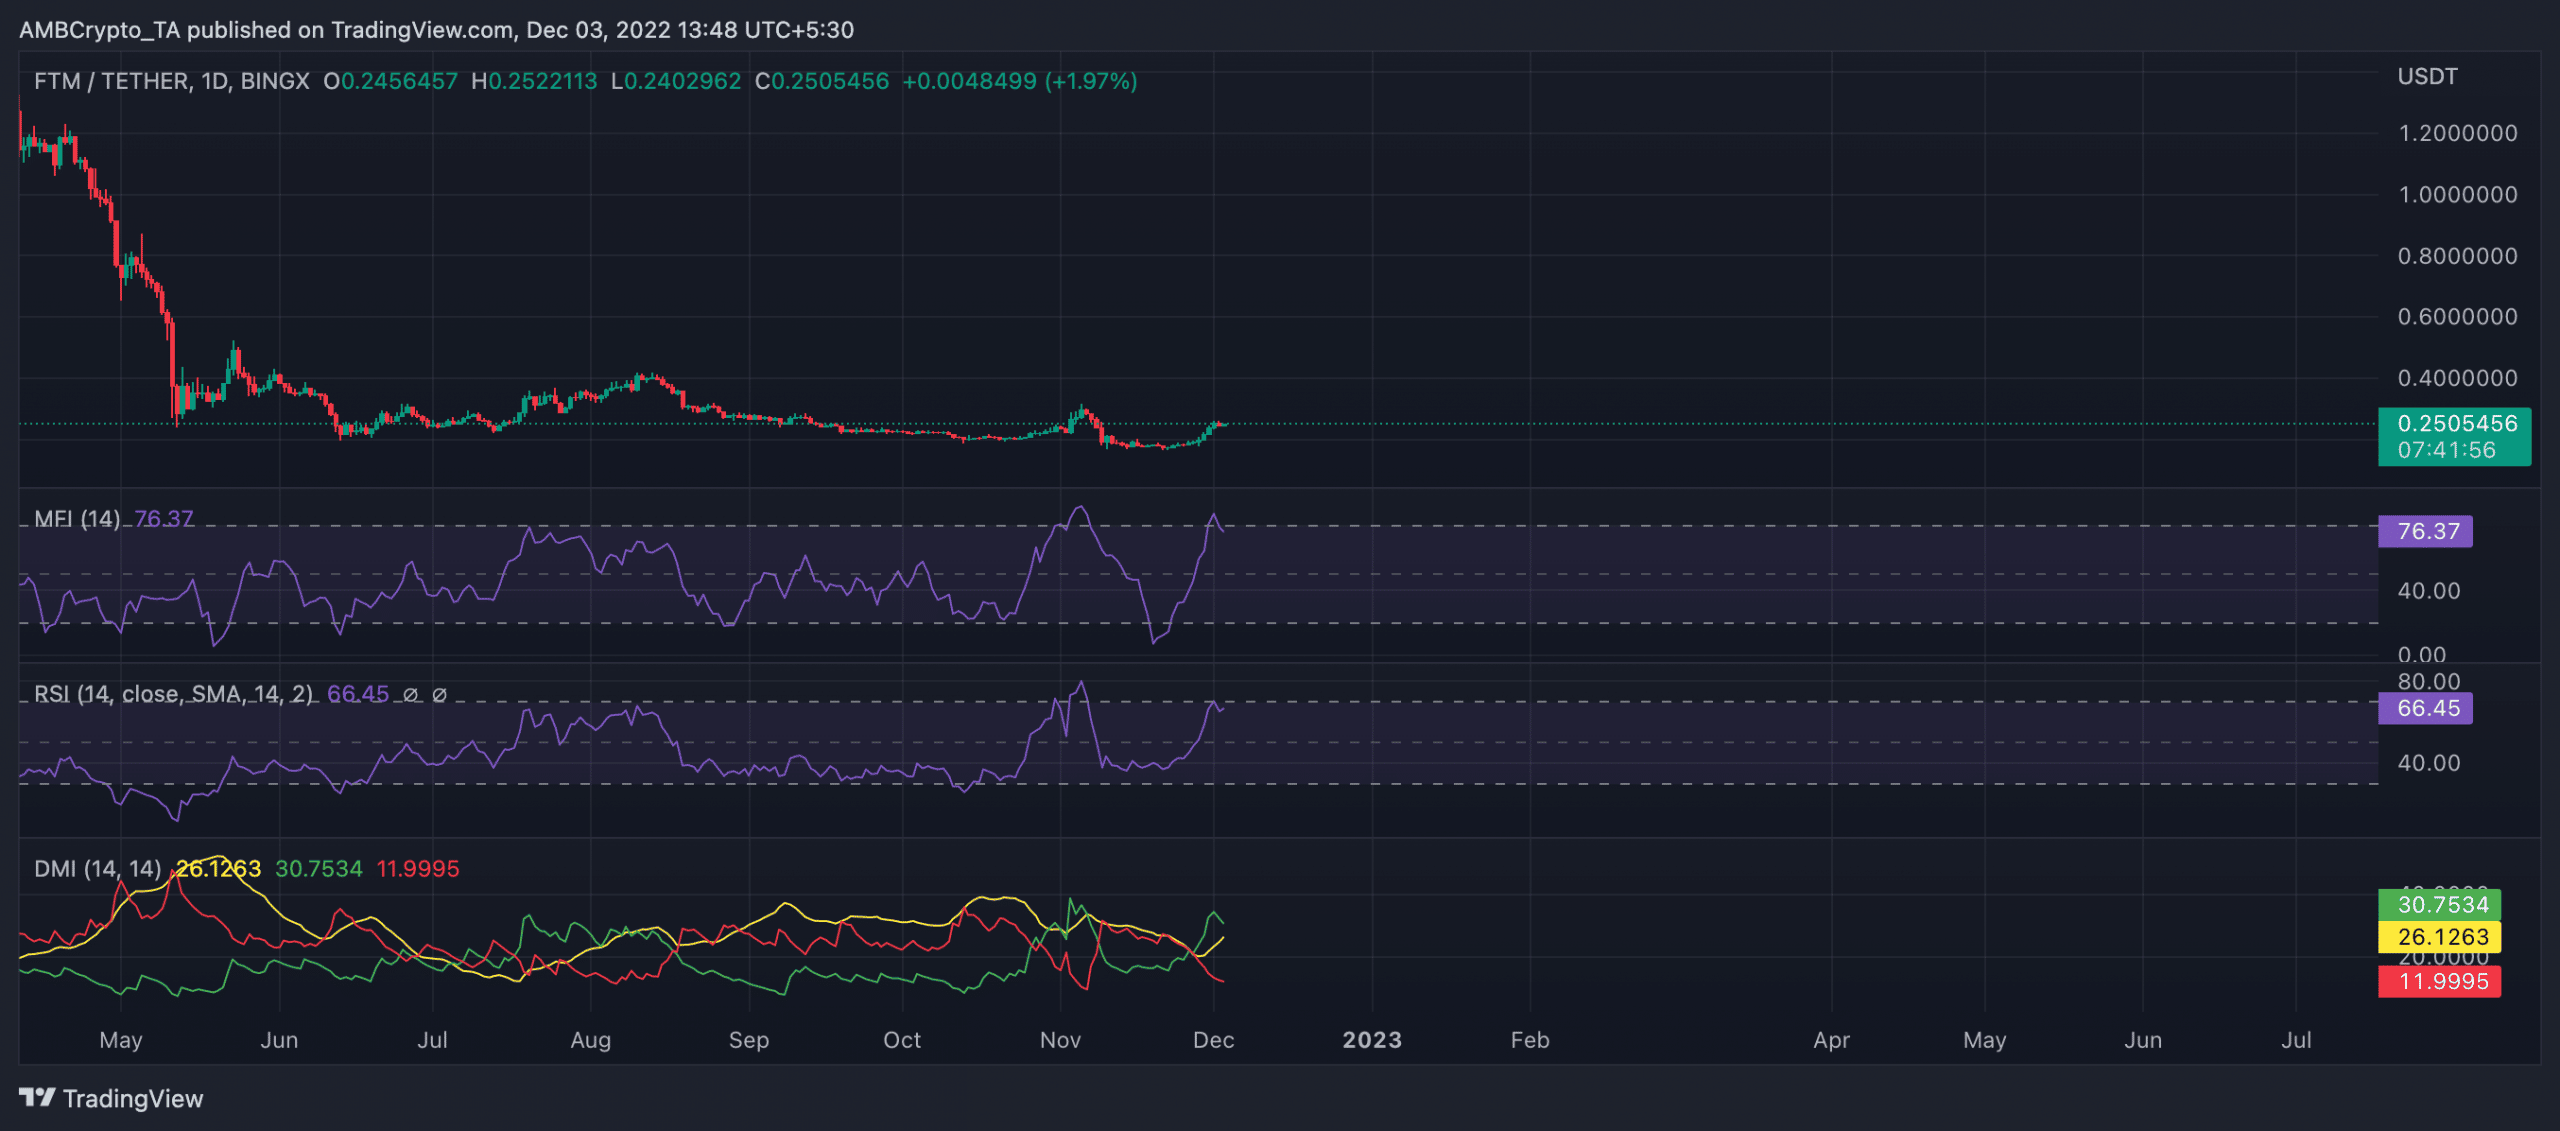
At its current price, FTM traded at its May price level. On a year-to-date basis. FTM lost 91% of its value. As the cryptocurrency market attempted to regain stability following FTX’s sudden collapse, FTM’s price embarked on an uptrend since 19 November. As observed on a daily chart, FTM accumulation since climbed significantly.
In the last two weeks, FTM went from being severely oversold to being overbought at press time. As of 19 November, FTM’s Money Flow Index (MFI) rested at 6.71, indicating massive sell-offs. However, as the bulls re-entered the market and began accumulation, the MFI proceeded on an uptrend and marked its spot at 76.37 at press time.
Toeing a similar progression, the Relative Strength Index (RSI) also rallied from a low of 38 on 19 November to rest above the 50-neutral spot at 66.45 at press time. This showed that FTM accumulation has surged in the past few weeks, hence the rally in price, per data from CoinMarketCap.
Further, buyers had control of the market at press time. FTM’s Directional Movement Index (DMI) showed that the buyers’ strength (green) at 30.75 was solidly above the buyers’ (red) at 11.99.
The Average Directional Index (yellow) at 26.12 showed that the buyers’ strength was a solid one that sellers might find impossible to revoke in the short term.
It is, however, important to note that overbought highs are not sustainable. Also, with the severe volatility in the current market, most market capitalize on a price rally to make profits. Hence, sell-offs might begin as soon as investors begin profit-taking.