Polkadot can push as high as $5, but is a bearish reversal imminent?

Disclaimer: The information presented does not constitute financial, investment, trading, or other types of advice and is solely the writer’s opinion
- Polkadot has an inefficiency on the price charts that extended from $4.7-$5
- Bulls are looking to push the prices past the $5 region, and a retest could be a buying opportunity
Polkadot has soared past the $4.35 resistance and broke the lower timeframe bearish market structure a few days ago. The asset hasn’t looked back since and went on to post gains of almost 7% since then.
Read Polkadot’s Price Prediction 2023-24
Can the bulls continue to assert their will on the market, or were the bears biding their time before striking back? At press time, the latter appeared likely. In either case, the $5 mark would be crucial.
Polkadot breaks out past important resistance levels
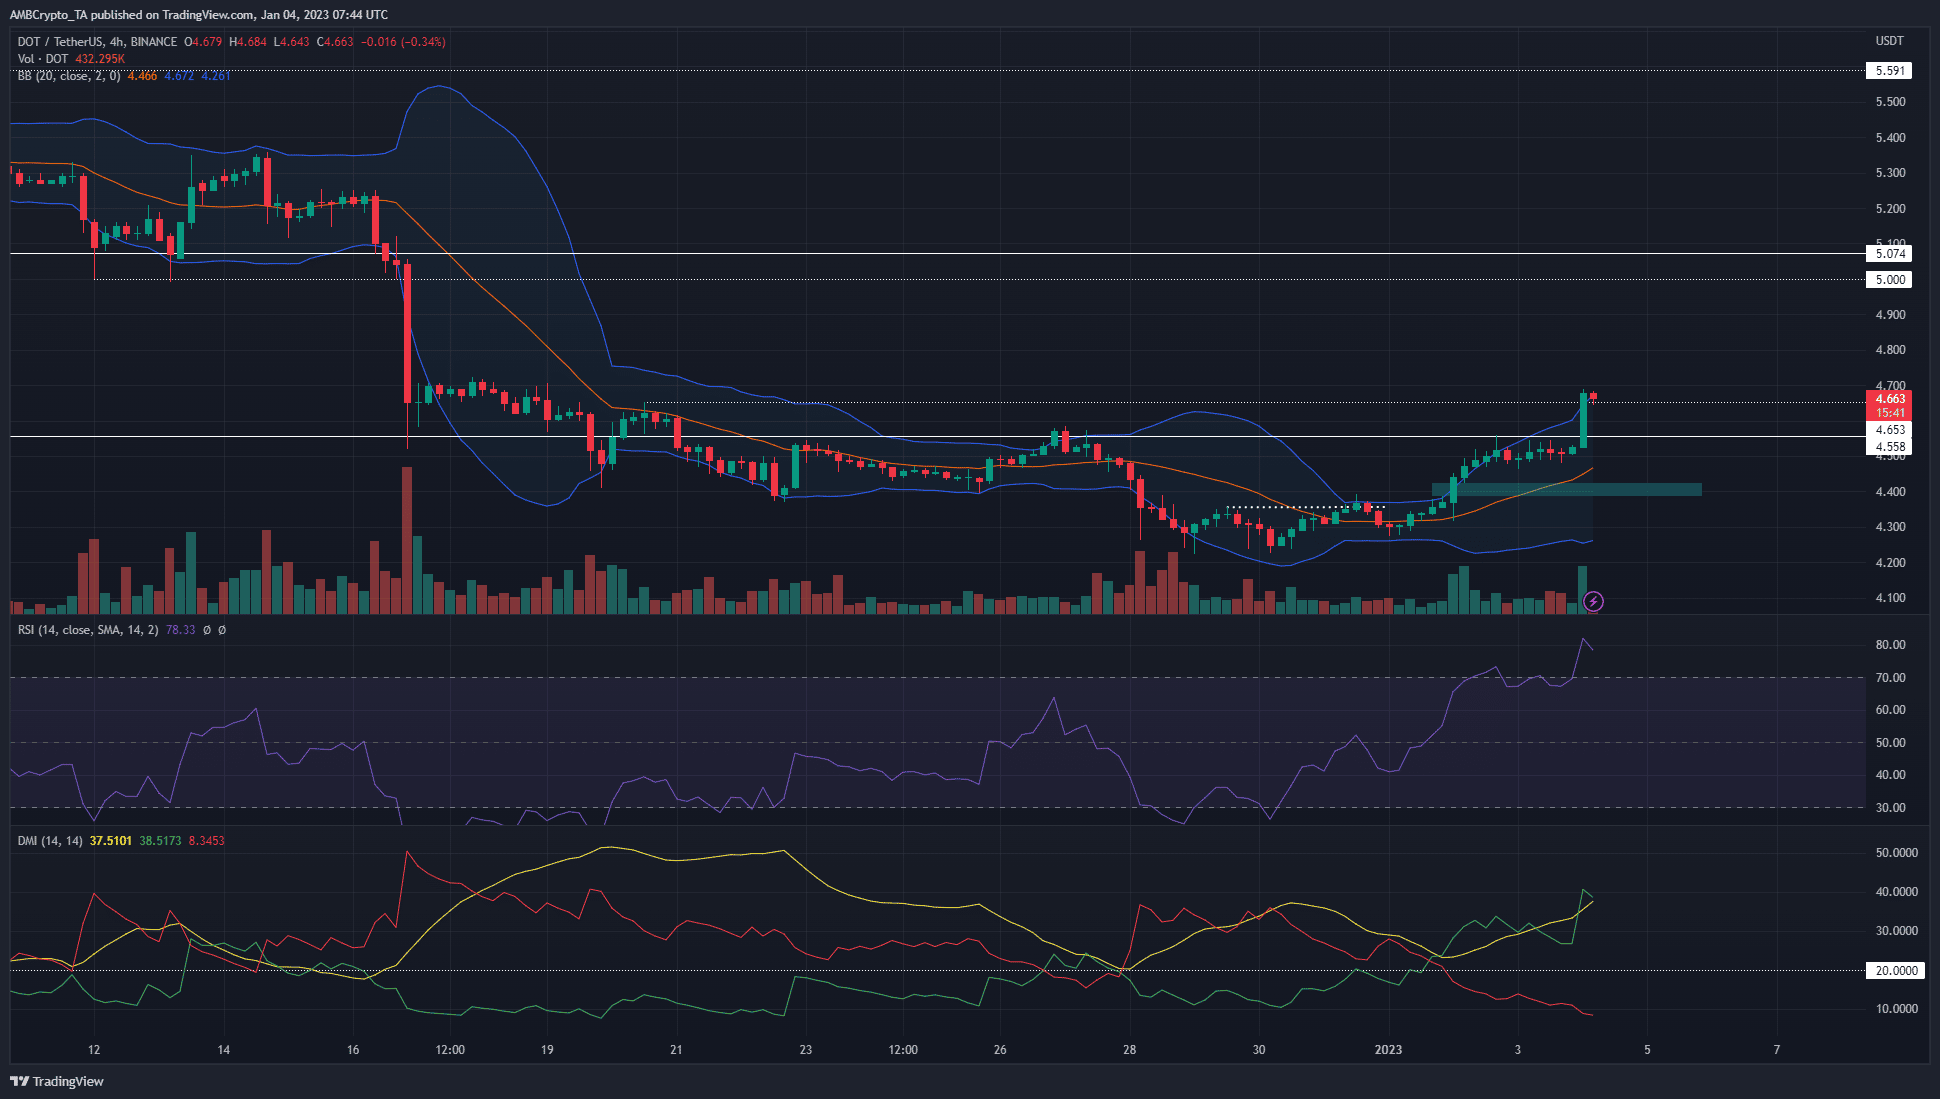
Polkadot has climbed past the $4.55 resistance. On the 4-hour chart, its structure flipped bullish in late December when DOT climbed above $4.35. The strong surge in the past few hours of trading reinforced bullish momentum. Trading volume was also high in the past few hours.
The Relative Strength Index (RSI) headed into overbought territory above 70 to indicate strong bullish momentum. However, the RSI did not yet signal a divergence or weakening bullish momentum. The DMI also showed a strong uptrend in progress. The +DI (green) was above 20, as was the Average Directional Index (ADX) line, which showed a significant upward trend in the past few days.
The Bollinger Bands (BB) saw a large expansion recently as well, indicating high volatility. The price has stuck to the upper band of the indicator. It appeared likely that the price would retest $4.66 as support and continue higher.
How many DOTs can you get for $1?
The higher timeframe charts such as the daily chart noted $4.7 to be an important level of resistance, with $5 as the next northward level of interest. There was also a fair value gap toward $5 as DOT plummeted rapidly through this area during the sell-off on December 16. Could DOT fill this inefficiency before a move downward once more?
Open Interest declined while the funding rate remained slightly positive
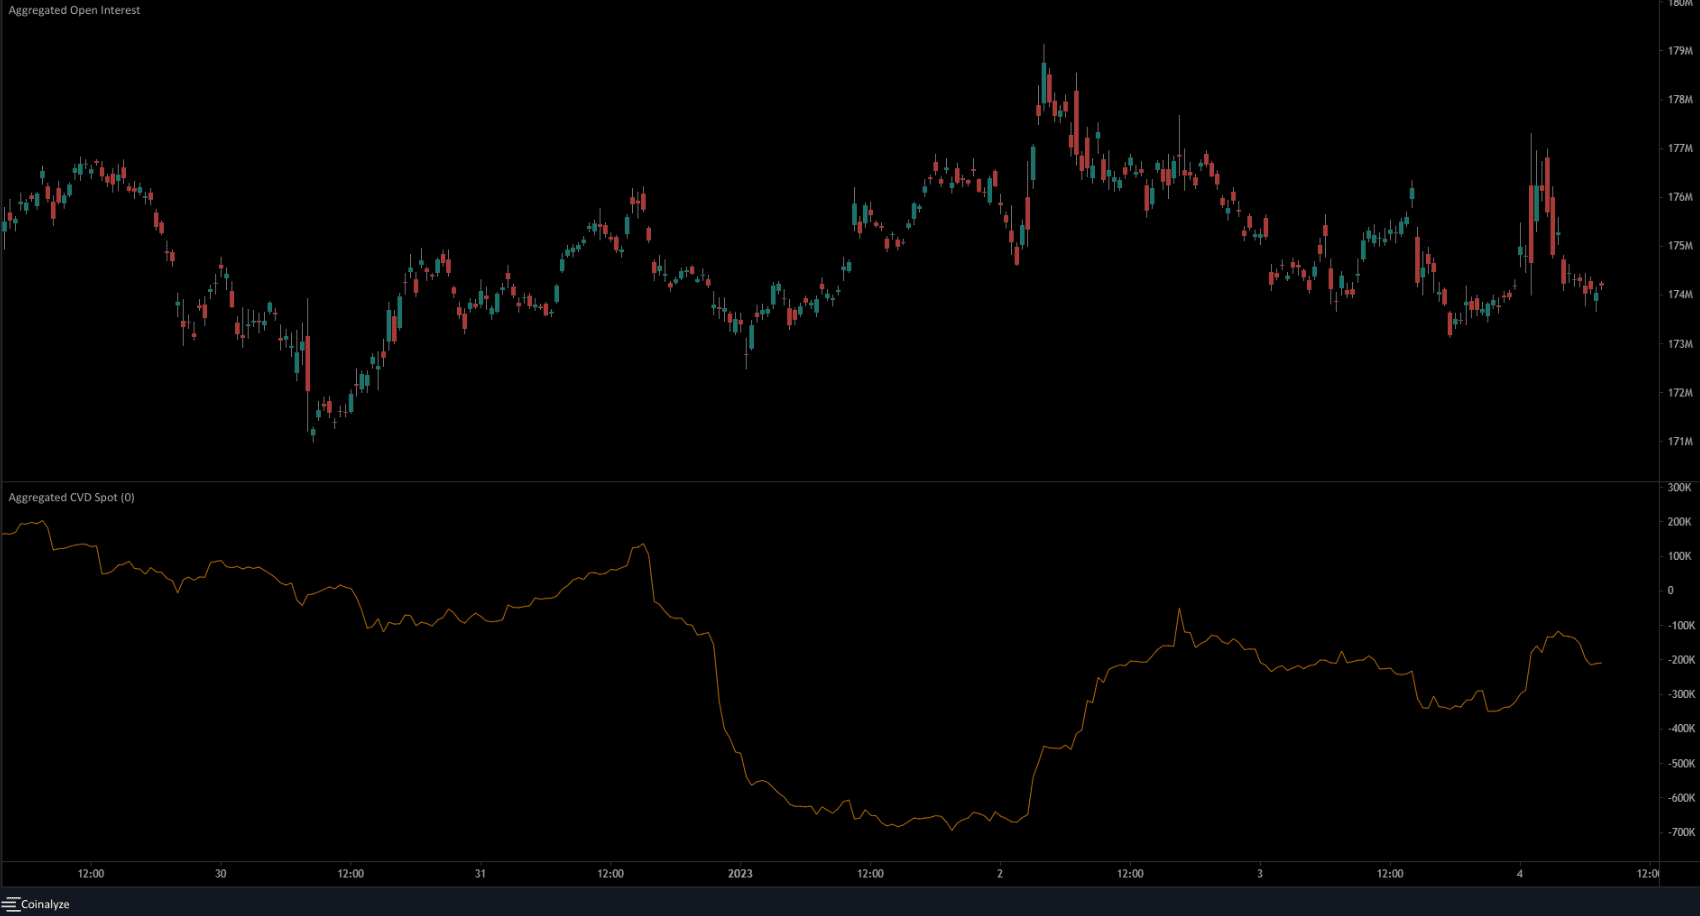
Data from Coinglass showed Bitmex and Binance have slightly positive funding rates on the DOT/USDT (or USD) pairs. This meant traders were bullishly positioned. The OI decreased in the past few hours, even as the price soared. This likely indicated long positions closed. The spot CVD has risen over the past two days as well.
Risk-averse traders can wait for a move above $5 and a retest before buying Polkadot. More aggressive traders can wait for a lower timeframe bullish structure break to look for shorting opportunities.