Should Ethereum Classic bulls wait for a dip to the range lows?

Disclaimer: The information presented does not constitute financial, investment, trading, or other types of advice and is solely the writer’s opinion.
- Ethereum Classic traded within a range.
- Range highs and range lows could be key over the next few days.
Bitcoin continued to consolidate around the $23k area. While it has a bullish bias, a dip toward $22.4k can not be ruled out. Ethereum Classic also has a higher timeframe bullish bias. Yet, in the near term, only three levels mattered.
Read Ethereum Classic’s Price Prediction 2023-24
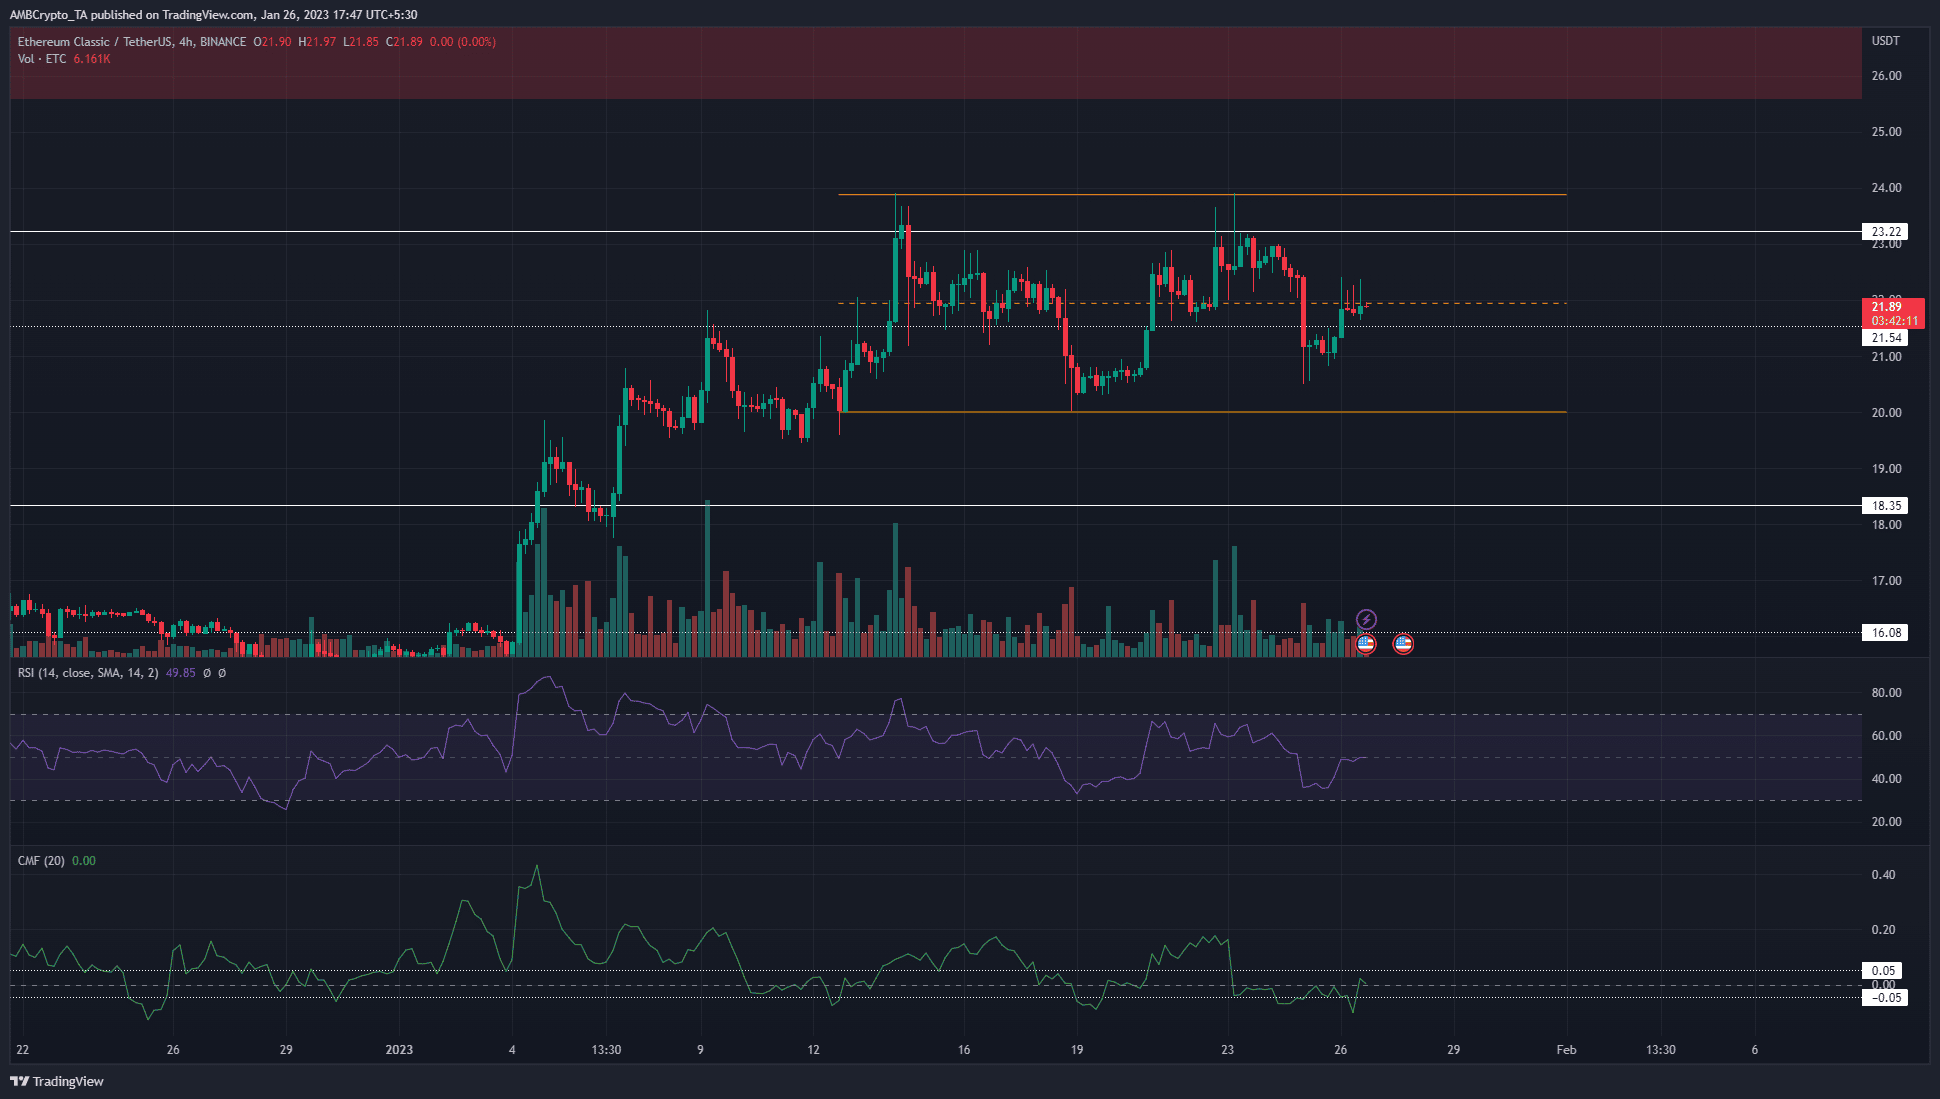
Bulls and bears skirmished at the range boundaries, and a breakout toward $26 was not yet in motion for ETC. Once this occurs, bulls can look to buy a retest of the range highs. In the meantime, traders can look for opportunities within the range.
The mid-point of the range meant R: R was the worst at this point
Ethereum Classic traded within a range from $20 to $23.88, with the mid-point at $21.94. Marked in orange, these are the three levels that have been important over the past two weeks. Lower timeframe traders can look to long a revisit of the range lows, and short a test of the range highs.
How much are 1, 10, 100 ETC worth today?
Sometimes trading and analysis can be extremely simple, and this was one of those times. Although Ethereum Classic has a higher timeframe bullish bias, the price action of the past two weeks indicated consolidation. We can not be certain of a breakout past $24 or a reversal beneath $20 yet.
The 4-hour RSI stood at neutral 50, and the CMF was at zero. Neither indicator showed any favor to the bulls or the bears as ETC traded at the mid-range mark at the time of writing. Taking a position, long or short, at this level could be risky without significant momentum and volume on the lower timeframes such as 1-hour or lower.
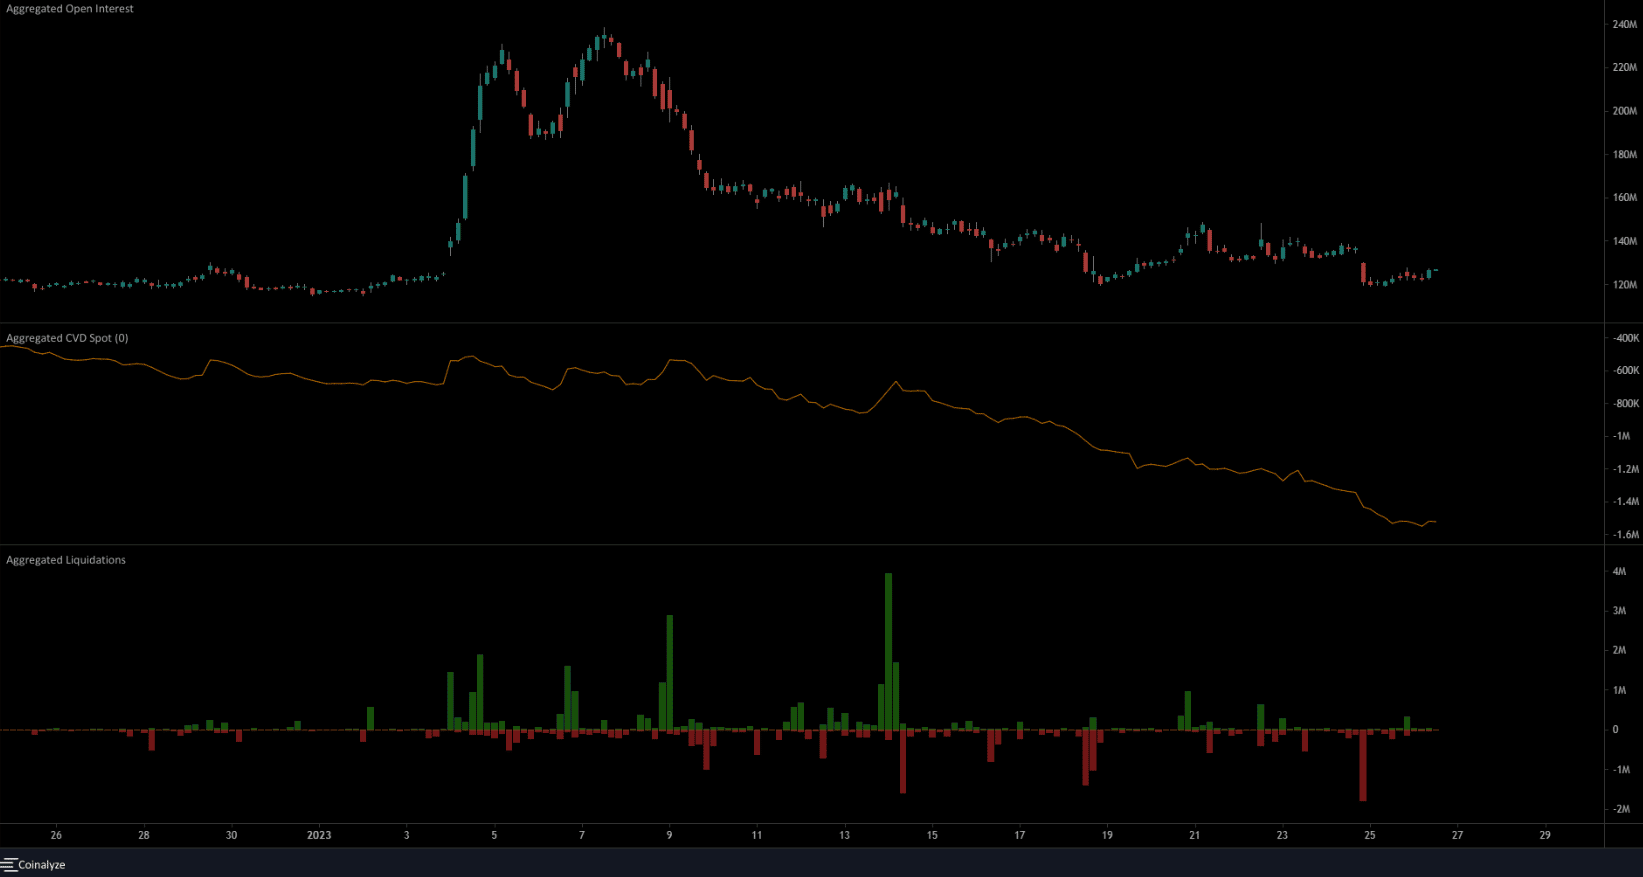
The declining OI and CVD highlighted the bearish sentiment

Source: Coinalyze
On the daily timeframe, ETC flipped the market structure to bullish after breaking above the lower high at $16.75. It surged above $18.45 on January 4 and retested the same level as support a day later. Therefore, despite the two-week range it currently traded within, the bias would remain bullish until ETC slipped back below $19.5.
Meanwhile, the futures market saw a fall in Open Interest. This has been a steady feature in the past ten days. Even when ETC bounced from the lows at $20 on January 19, OI did not register sizeable gains. This indicated weak bulls, and the next step could be emboldened bears. A rise in OI alongside a drop below $20 could precede a flip to bearish dominance.
On January 24, ETC fell from $22.42 to reach $20.56 within a 4-hour trading session. This session saw $1.7 million worth of long positions liquidated. At press time, the bulls wrestled with the $21.94 level. The long positions being liquidated may be followed by an ascent back to the range highs.


