Aave: V3 deployment sees increased traction in just three days of going live

- Aave V3 is live on Ethereum and has since seen increased activity.
- Buying momentum for AAVE is on a decline.
Following unanimous support from its community members, leading decentralized lending and borrowing protocol Aave deployed its V3 iteration on the Ethereum network on 27 January.
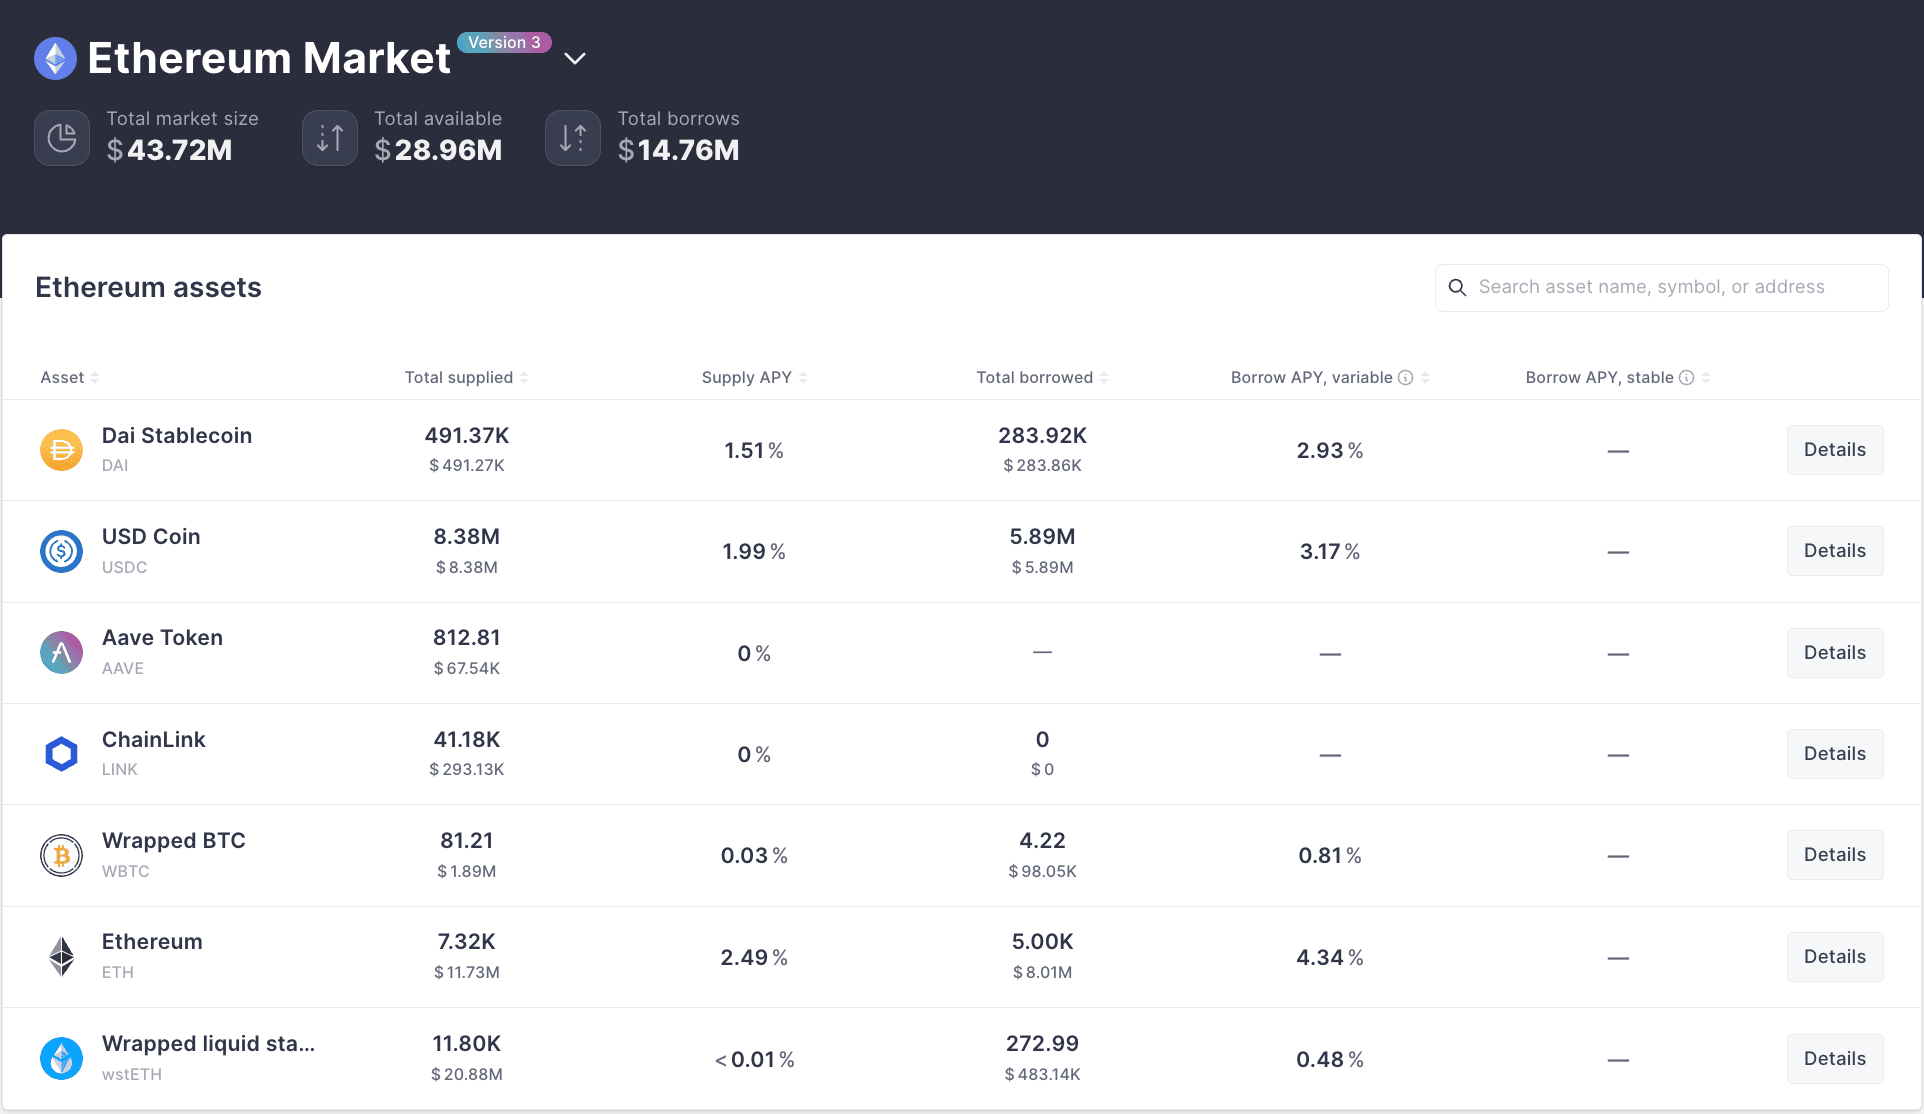
Since it launched on the chain, it has attracted $28.96 million in deposits and $14.76 million in loans.
How much are 1,10,100 AAVEs worth today?
State of Aave V3 on Ethereum
Aave V3 deployment includes seven cryptocurrencies, such as DAI, USDC, AAVE, LINK, ETH, WBTC, and wsETH. Since it became operational on Ethereum, ETH’s supply on Aave V3 has been the highest of all the assets the iteration holds.
As of this writing, 7320 ETH coins worth over $11 million have been supplied to the protocol.
Of the 7,320 ETH supplied, 5,000 ETH has been borrowed so far, thereby making ETH the most-borrowed asset on the protocol. USDC followed closely, with $5.89 million worth borrowed from its $8.38 million supply since its launch on 27 January.
So far, no loan requests have been made for AAVE and LINK tokens. Also, the yield earned on the supply of these assets to Aave V3 on Ethereum was at 0% at the time of writing.
Read Aave’s [AAVE] Price Prediction 2023-2024
AAVE on a daily chart
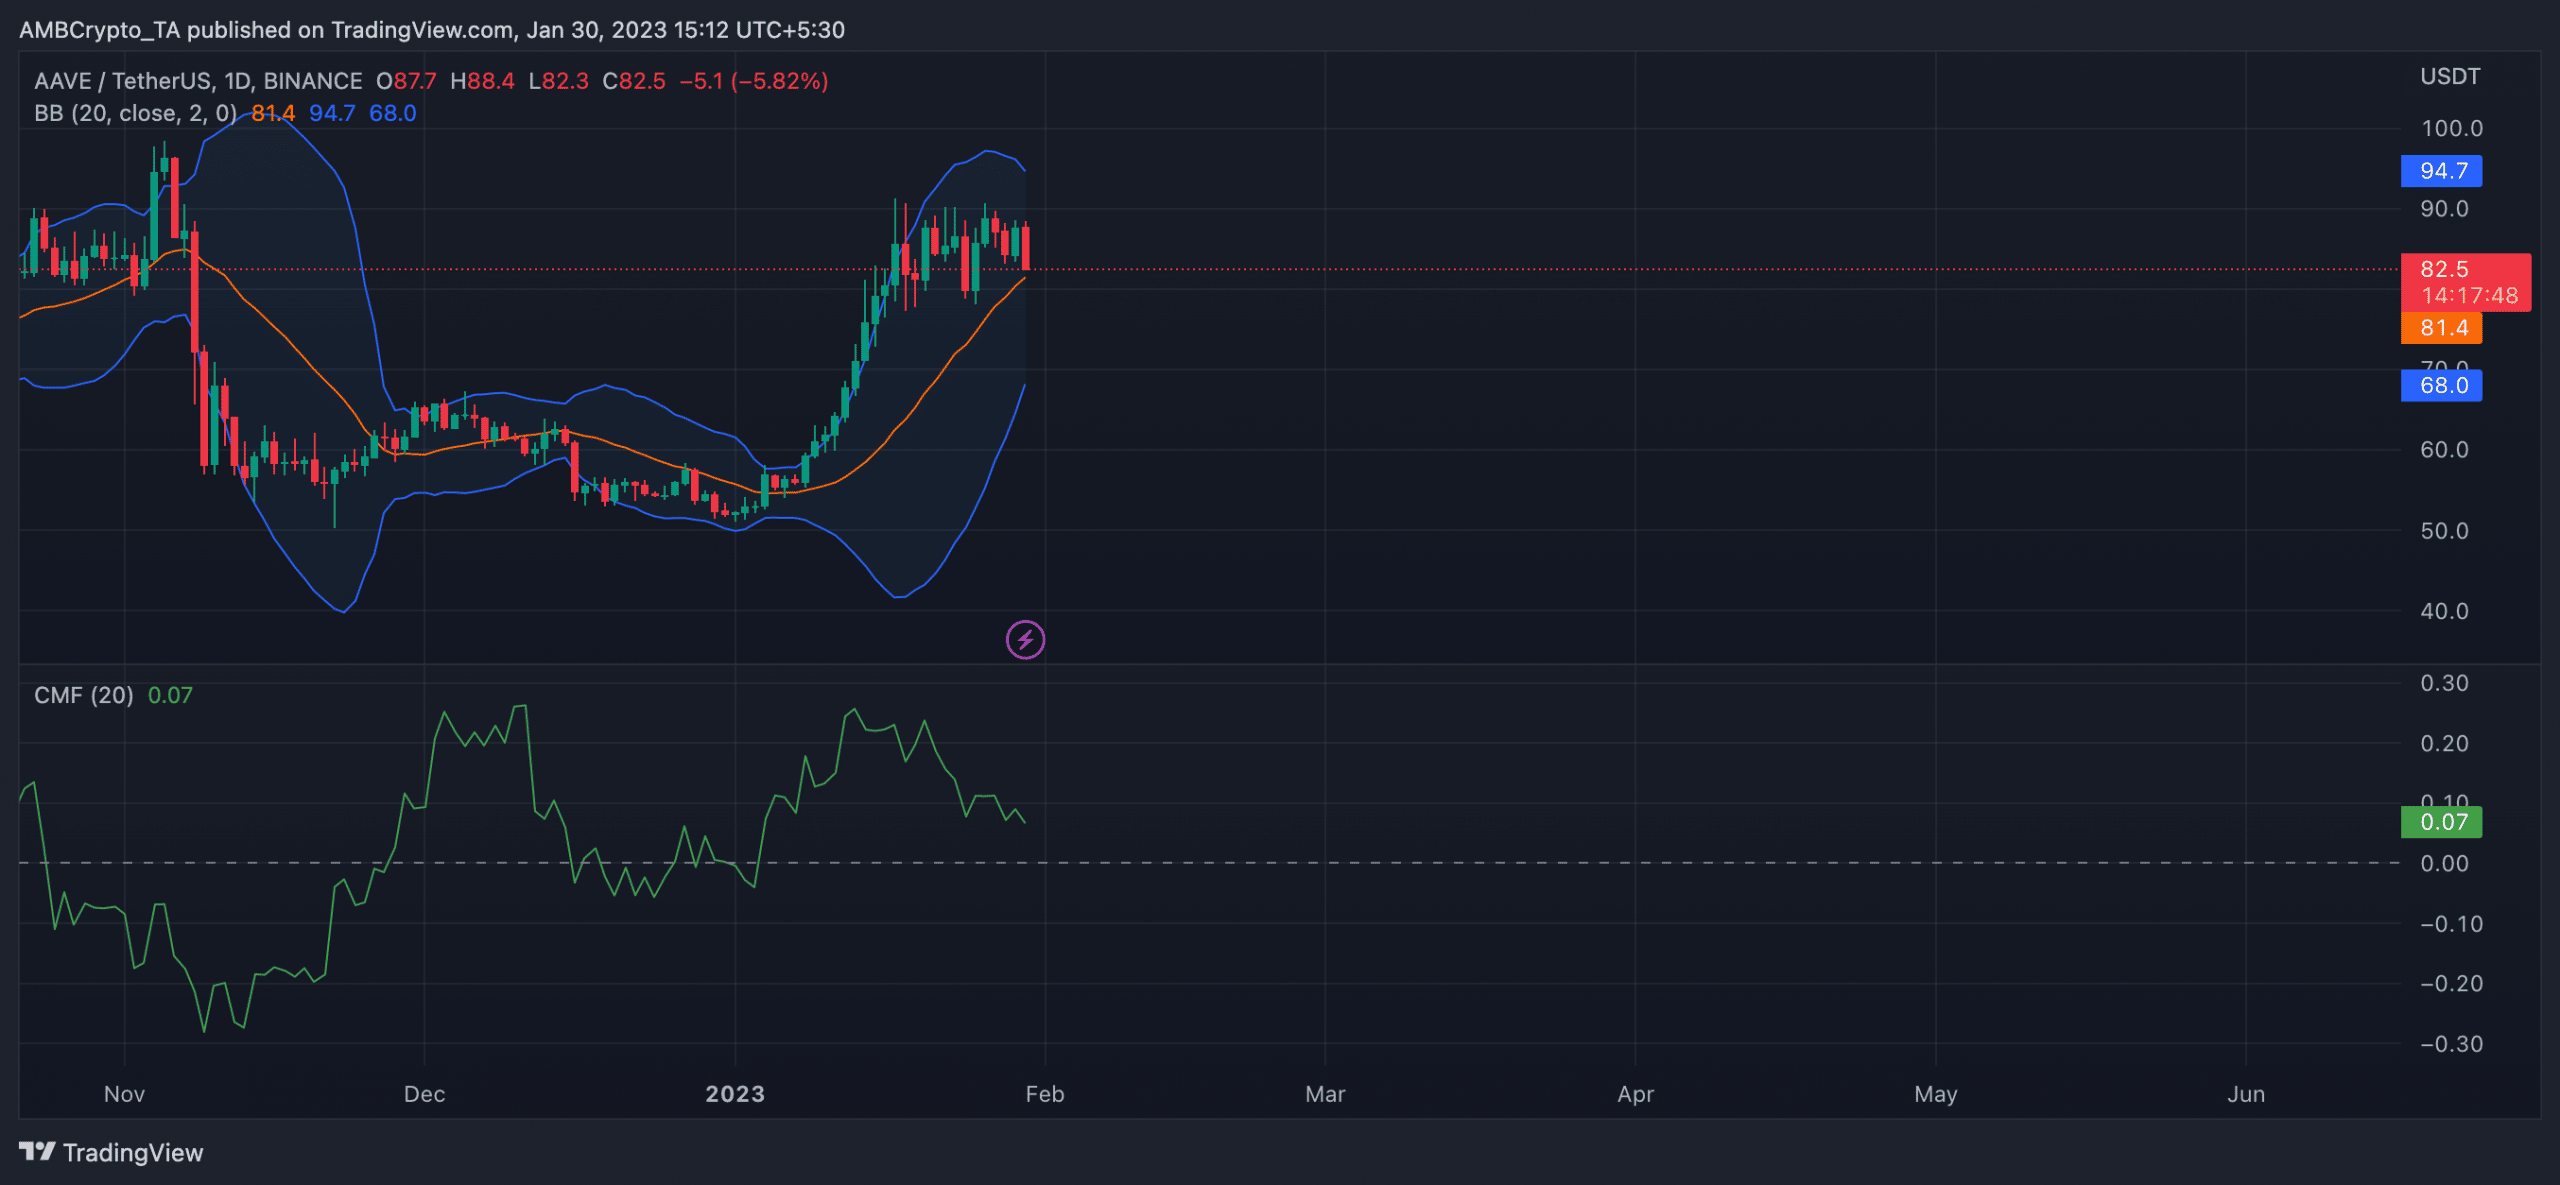
At press time, AAVE traded at $83.34. In the last week, the alt’s price was severely volatile and oscillated between $86 and $88. In fact, at some point during the week, AAVE traded at a low of $80.
An assessment of AAVE’s Bollinger Bands (BB) on the daily chart confirmed that the price volatility might be decreasing. The alt’s price was spotted moving away from the upper band towards the middle band.
However, it should be noted that a further price movement toward the lower band indicates increased selling pressure and a potential oversold signal. The reading of the token’s Chaikin Money Flow (CMF) lent credence to this position.
While AAVE’s price oscillated in a tight range in the last week, its CMF declined. Still, on a downtrend at press time, the CMF was 0.07.
When an asset’s price oscillates in a tight range and its CMF declines, it may indicate a shift in market sentiment from bullish to bearish.
In other words, there is an absence of strong buying pressure and an increase in selling pressure, indicating a bearish trend in the market.