TRON’s [TRX] sideways structure persists amidst upcoming FOMC meeting
![TRON's [TRX] sideways structure persists amidst the upcoming FOMC meeting](https://ambcrypto.com/wp-content/uploads/2023/01/daryan-shamkhali-s2mdS_xZKe8-unsplash-scaled-e1675172997262.jpg)
Disclaimer: The information presented does not constitute financial, investment, trading, or other types of advice and is solely the writer’s opinion.
- TRON could continue to trade in a range for the next few hours.
- TRX’s demand decreased slightly but remained positive.
TRON [TRX] continued to trade in a price consolidation range amidst a scheduled FOMC meeting on 31 January. At press time, TRX was valued at $0.06235. The asset witnessed a sharp drop after hitting a key supply zone.
Is your portfolio green? Check out the TRX Profit Calculator
In addition, Bitcoin [BTC] broke below the $23.5k level, accelerating its short-term price correction. Although TRX flashed green by press time, the market was cautious amidst the upcoming FOMC meeting, which could further constrict the price action within this consolidation range.
The $0.06178 – $0.06368 range: Is a breach likely?
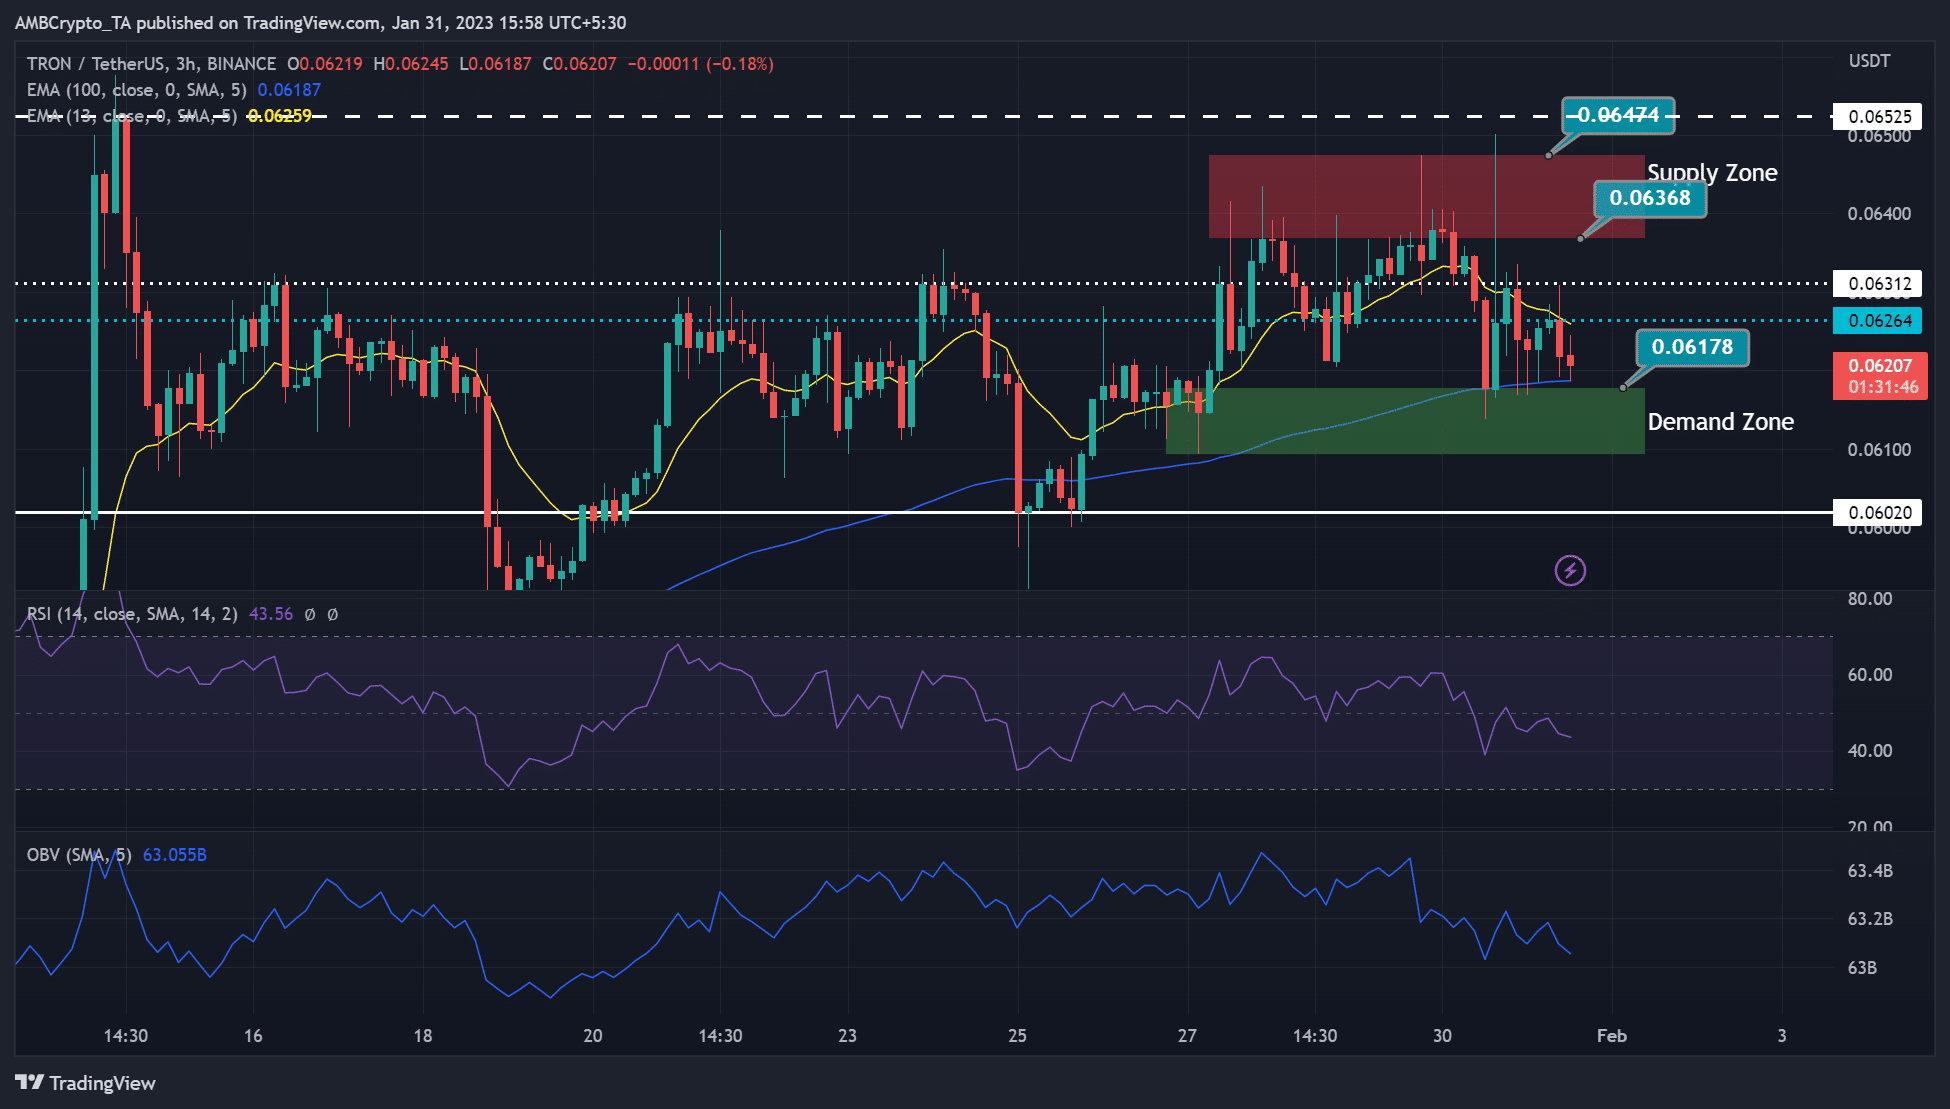
The Relative Strength Index (RSI) and the On Balance Volume (OBV) exhibited fluctuations on the three-hour chart. In particular, the RSI pattern showed historical rejection at the mid-level of 50.
As such, the sideways trading pattern within the $0.06178 – $0.06368 range could extend for the next few hours. In addition, upward momentum must deal with the hurdles at $0.06264 and $0.06312 and the short-term supply zone above $0.06368. On the other hand, a drop within the range could be held by the 100-period EMA (exponential moving average).
However, a breach of the above price consolidation range would invalidate the above bias. A drop below the demand zone could settle at $0.06020, while a breach above the supply zone could retest the $0.06525 resistance level.
TRX’s sentiment and demand dropped, but …
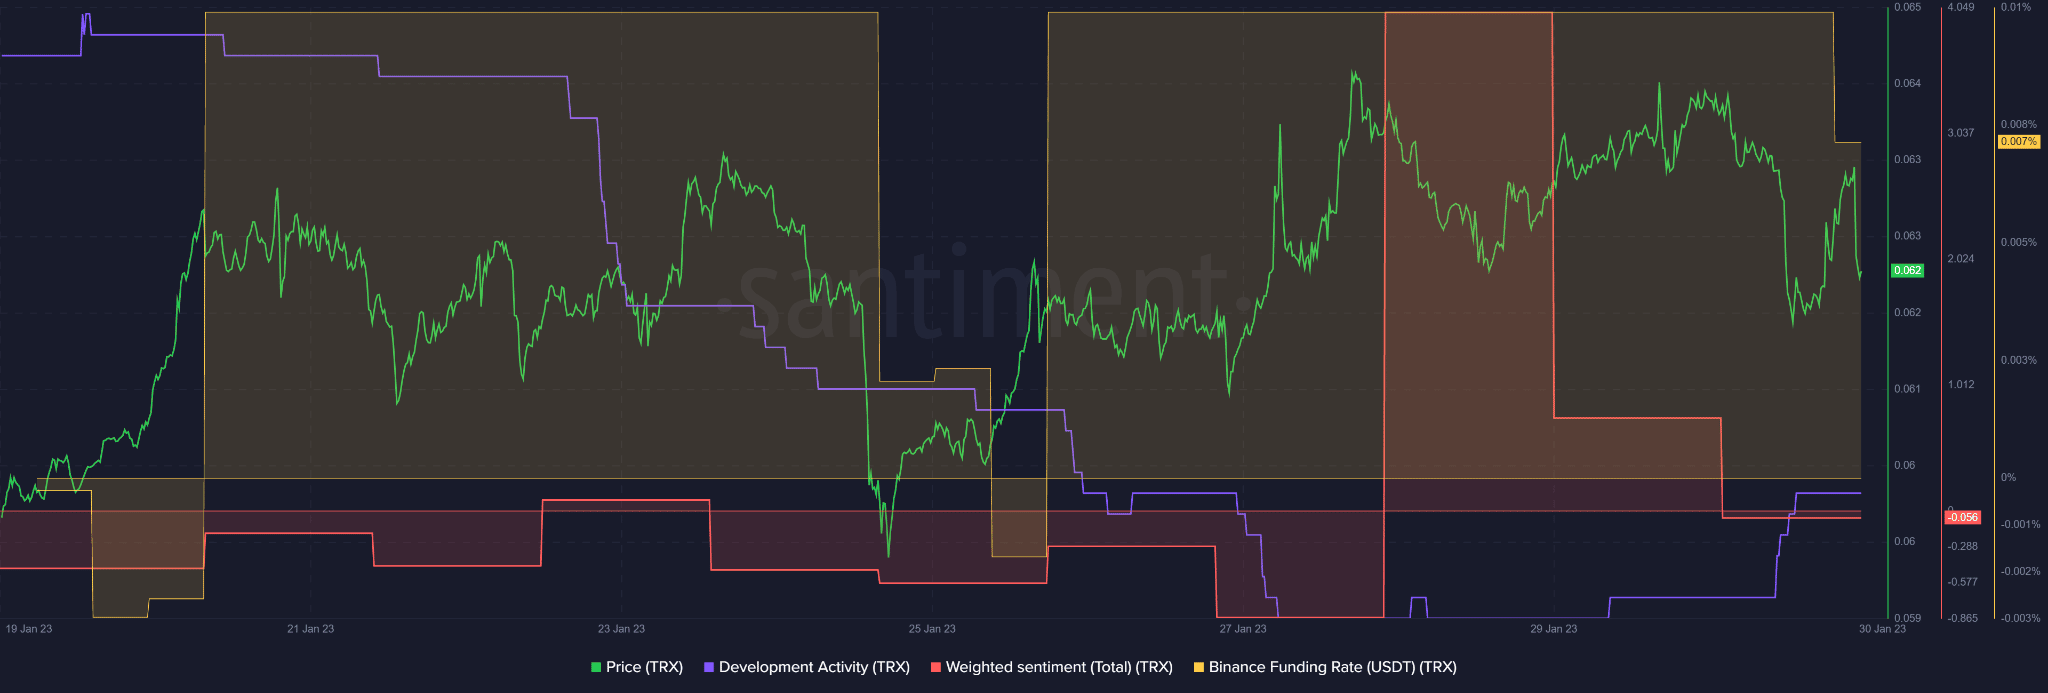
As per Santiment’s data, TRX’s investors were bearish on the asset, as weighted sentiment dropped and turned negative. Such a development could tip bears to push TRX to the short-term demand zone indicated on the three-hour chart.
Read TRON’s [TRX] Price Prediction 2023-24
Similarly, the Funding Rate for the TRX/USDT pair on Binance Exchange dipped slightly, indicating a drop in demand for the asset. However, the Funding Rate remained positive, indicating TRX still had a chance of price reversal and a potential uptrend rally aimed at the supply zone.
In addition, the TRX recorded an uptick in development activity which could bolster investors’ confidence in the long run. Thus, the countering metrics suggest a likely fluctuation in TRX prices. Investors and traders should track BTC’s price action for clear momentum direction.