How SAND has fared since the commencement of its token unlock

- The Sandbox commenced a token unlock process of 170 million SAND tokens.
- The market has since traded in a tight range.
In the last 12 hours, The Sandbox executed a massive unlock rollout, releasing a total of 170 million SAND tokens worth $130 million.
The unlock was carried out from three multi-signature addresses, with 97 million SAND tokens transferred from the Genesis address, 48 million from the Multisig address, and 25 million from the Advisors Vault address.
Out of the total amount released, 78 million SAND tokens worth $60 million were directly transferred to the Binance deposit address.
In the past 24h, Sandbox has started to be unlocked on a large scale. A total of 170m SAND has been transferred from the multi-signature address, of which 78m ($60M) was directly transferred to the Binance deposit address. H/T @BitcoinEmber https://t.co/irzFgR1wtY
— Wu Blockchain (@WuBlockchain) February 5, 2023
The transfer of a substantial sum of SAND tokens to a cryptocurrency exchange marks a major event for The Sandbox and its community, as it makes the unlocked tokens accessible for trading purposes.
Read SAND Price Prediction 2023-24
How has the market reacted?
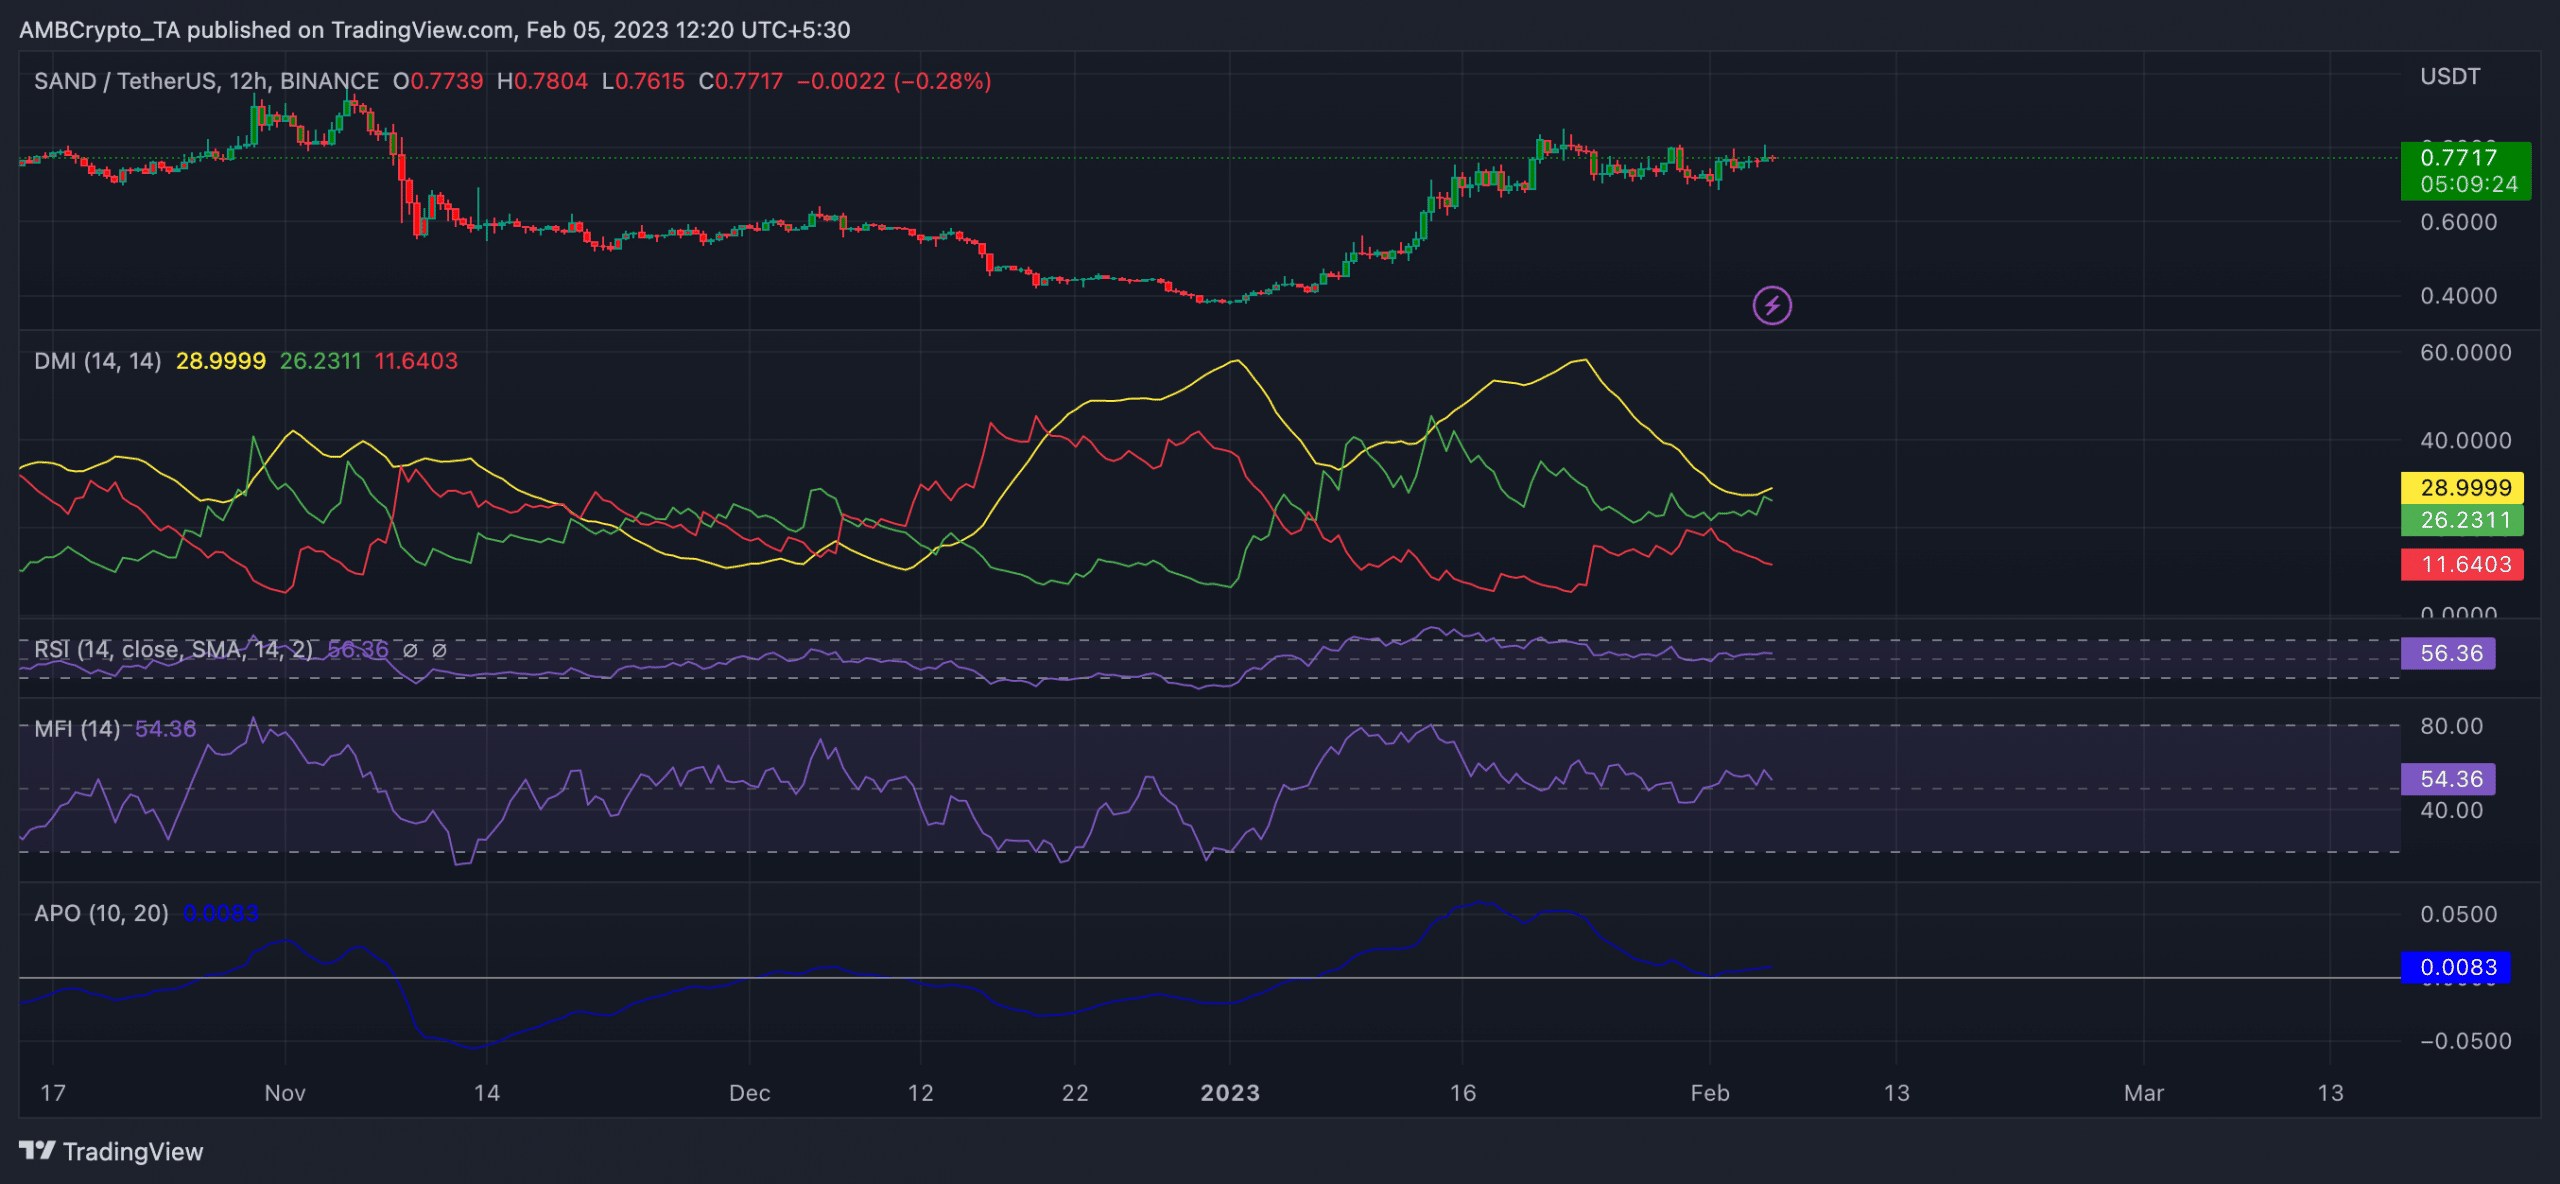
At press time, SAND exchanged hands at $0.7688, per data from CoinMarketCap. In the last 24 hours, the price of the metaverse-based token rose by 2%. Trading volume was also up by 13% during that period.
The rally in price was, however, attributable to the 1% jump in Bitcoin’s [BTC] price within the same period, as a look at SAND’s performance on a 12-hour chart revealed that the market moved sideways.
When the price of a crypto asset trades in a tight range, it is usually taken as an indication of low volatility. In addition, it often signifies indecision among buyers and sellers who cannot drive the price in either direction.
This results in a period of consolidation where the market is waiting for a catalyst to drive the price in a particular direction.
Is your portfolio green? Check out the SAND Profit Calculator
At press time, key momentum indicators remained flat. The alt’s Relative Strength Index (RSI) and its Money Flow Index (MFI) rested at 56.36 and 54.36, respectively.
Additionally, as SAND traders awaited a decisive price movement, the buyers’ hold on the market weakened. This was revealed by the Directional Movement Index (DMI) position.
At press time, the Positive Directional Indicator (green) was in a downtrend at 26. Furthermore, the Average Direction Index (yellow), also in a downtrend at 28, confirmed that the buyers’ strength had waned significantly.
Lastly, an assessment of SAND’s Absolute Price Oscillator (APO) showed a low possibility of a price upward burst in the short term. At press time, it was pegged at 0.0083. A smaller positive value for an asset’s APO typically indicates a weak upward trend