Here’s what’s next for BNB after a spike in its transaction volume

- BNB resisted going down with the rest of the crypto-market
- Unrealized profits of short-term holders increased
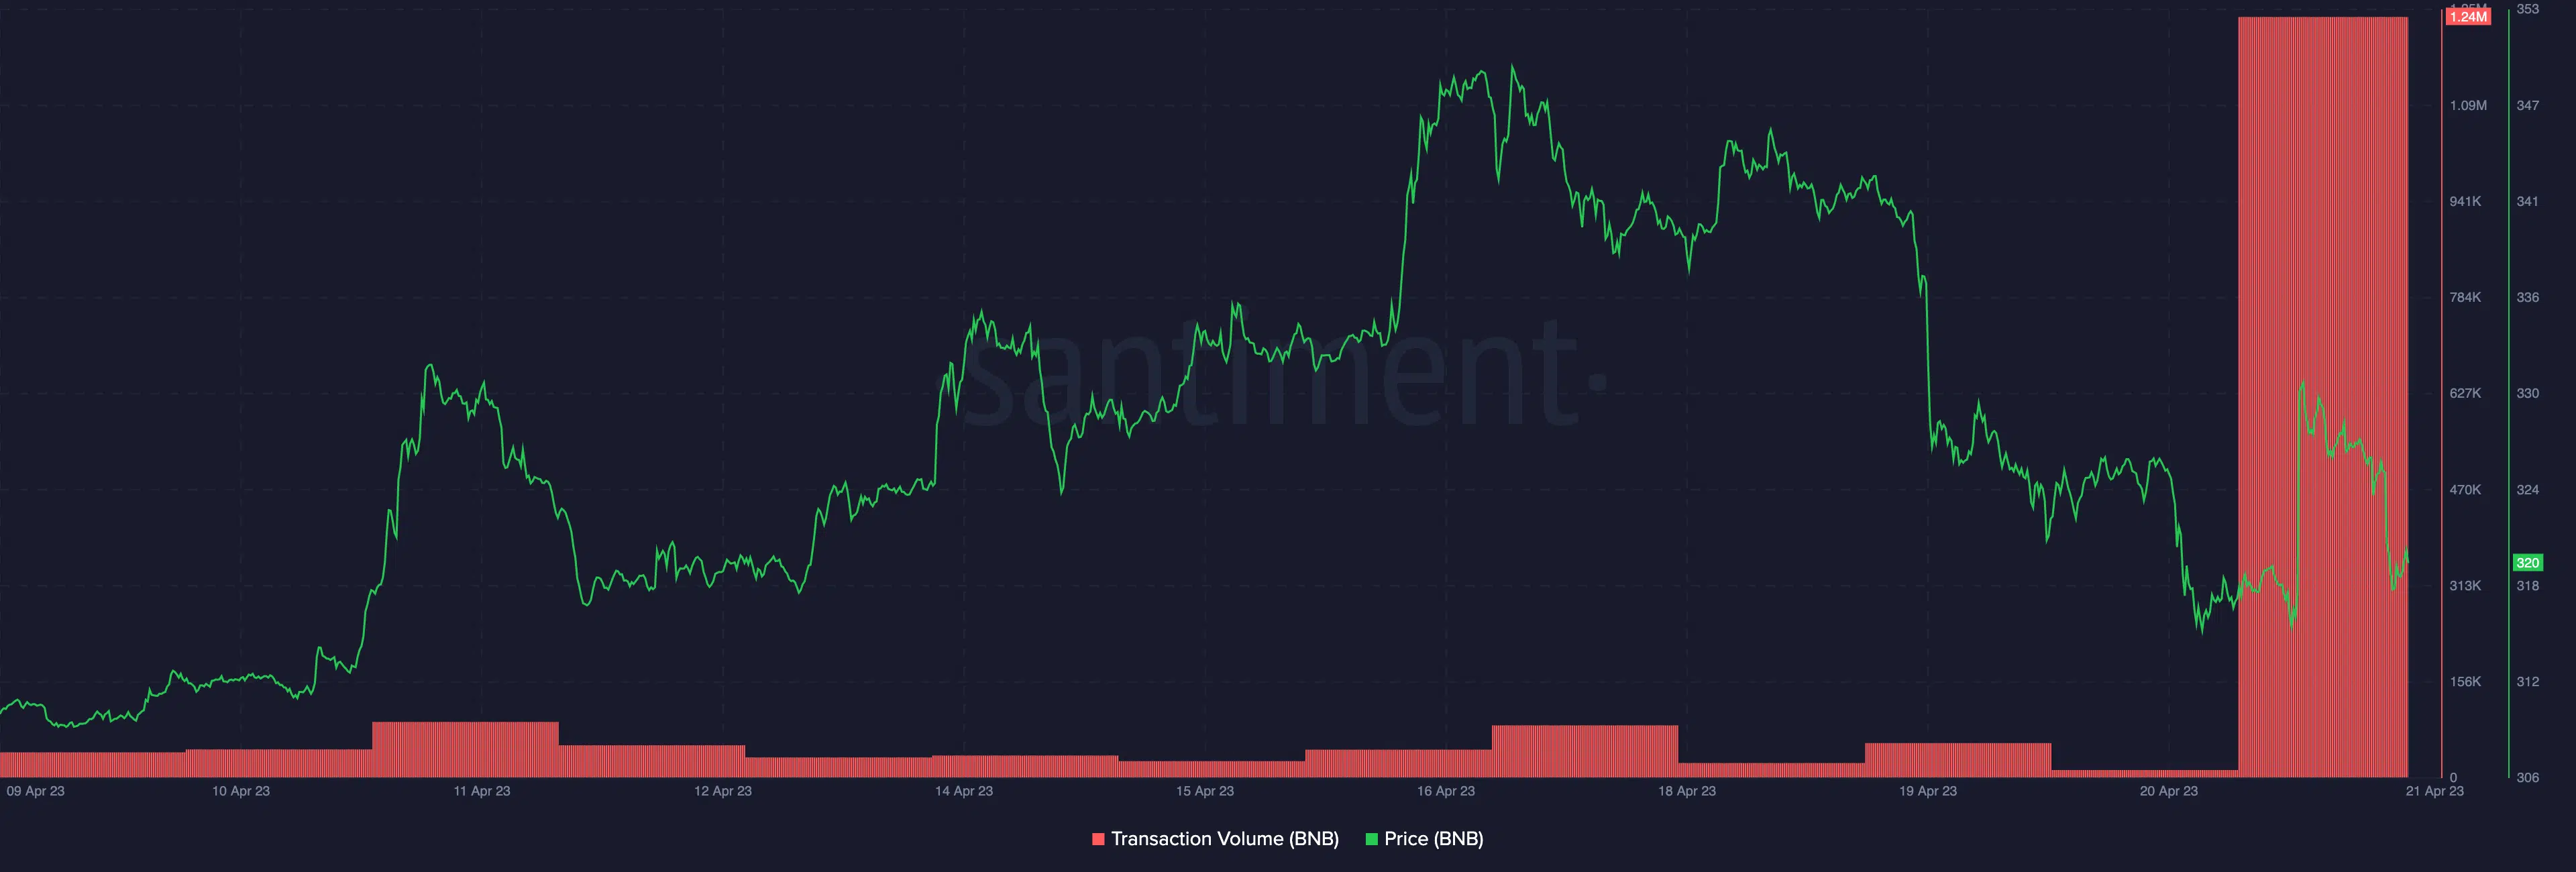
At a time when the broader crypto-market was recording a severe decline in volume, Binance Coin’s [BNB] transaction volume hit its highest volume since February. In fact, according to Santiment, this has been no small feat either, especially as the metric rose to 1.24 million.
Is your portfolio green? Check the Binance Coin Profit Calculator
These sort of circumstances are usually characterized by increased buying of assets. Additionally, a surge in volume can serve as an impetus for cryptocurrency prices to soar. However, there are some conditions to this –
The ‘power’ behind BNB’s value
Rising volumes on decreasing value could be a sign of declining momentum and a potential reversal. However, it was different in BNB’s case.
As the transaction volume increased, so did the coin’s price which was able to decouple from the dumps on Bitcoin [BTC] and Ethereum [ETH].
Thus, the decoupling could be an indicator of rising price momentum. Nonetheless, BNB’s price growth has been sideways and is subject to market volatility.
However, the coin’s ability to override a seven-day BTC-like 10% decrease has resulted in sustained profits for its holders.
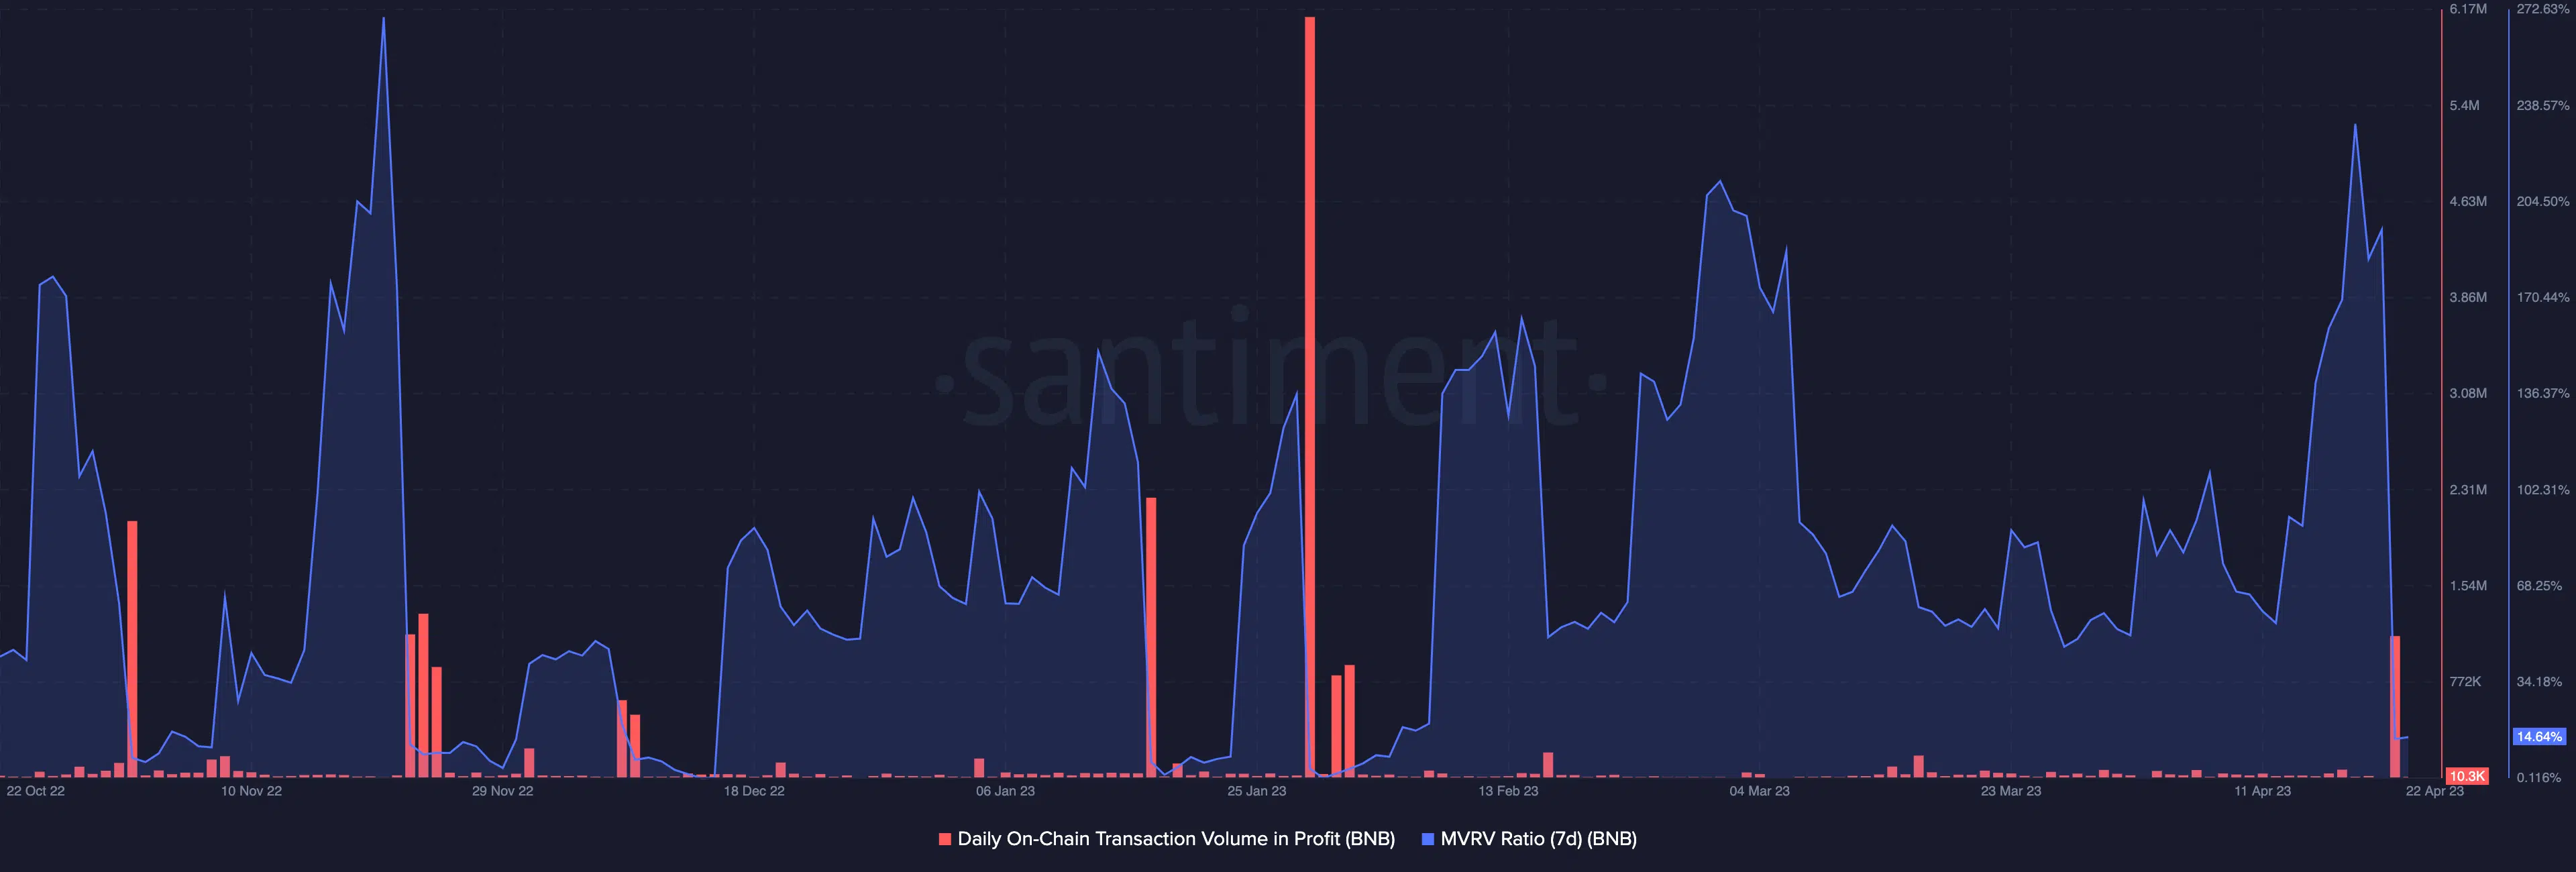
Although the daily on-chain transaction volume in profit fell to 10,300 at press time, it is noteworthy to mention that the metric skyrocketed to 1.1 million on 21 April.
This hike implied that a majority of coins that passed through the BNB network moved in profit than loss. Consequently, the move culminated in a hike in the crypto’s Market Value to Realized Value (MVRV) ratio.
Positive values for this metric infer that short-term holders have made unrealized profits. Also, the MVRV ratio serves as an indicator to determine the undervaluation of an asset or the opposite.
In between uncertainty and a chance
In markets like this, a quick retracement of the MVRV ratio might act as a signal that the asset can be undervalued. However, the seven-day MVRV ratio remained in the positive zone and it would need to drop into the danger zone for short-term holders to confirm an opportunity.
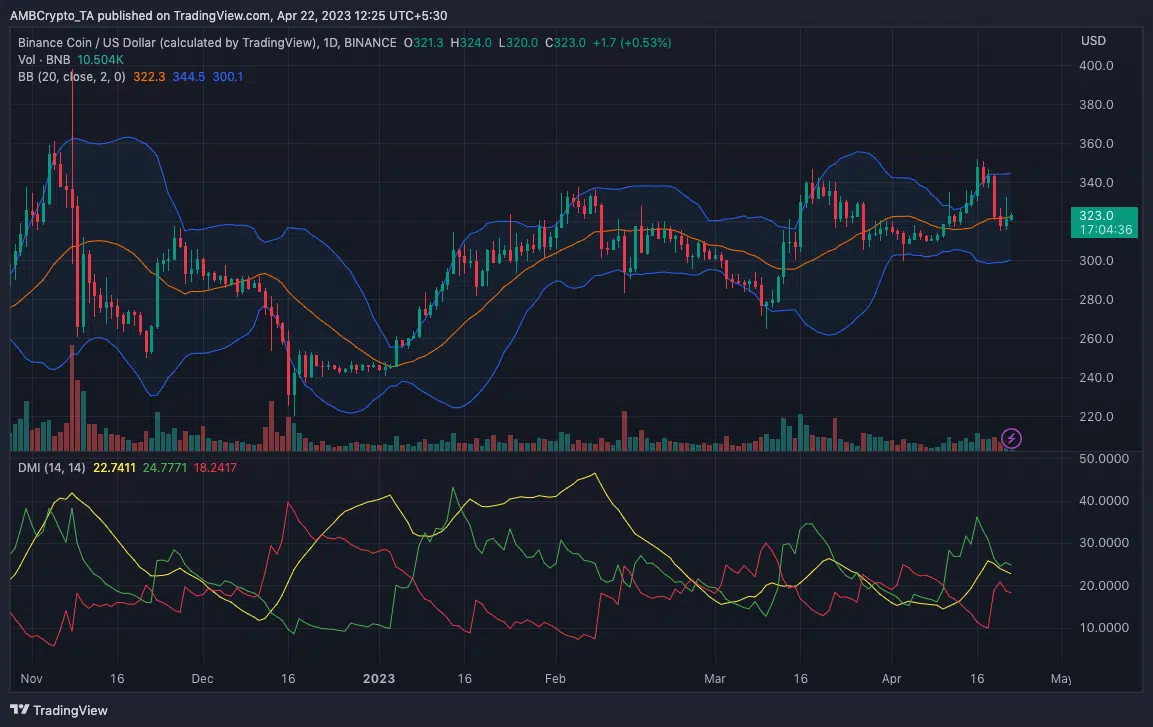
On the price charts, BNB seemed to be recording a high level of volatility, based on the indications from the Bollinger Bands (BB). However, the coin also exited the overbought zone since the price no longer touched the upper band.
How much are 1,10,100 BNBs worth today?
And, such an instance suggested considerable buying momentum for BNB. However, the Directional Movement Index (DMI) showed consolidation. At press time, the +DMI (green) was at 24.77 while the -DMI (red) was hovering near 18.24.
Additionally, the Average Directional Index (ADX) had a reading og 22.74. When the ADX (yellow) hits or rises above 25, it indicates strong directional movement. On the contrary, when it’s below the value, it means that the support was not hefty.


