18-month high for Solana means this for SOL’s price prediction

- SOL’s positive sentiment is now at an 18-month high
- While SOL demand continues to hike, volatility has set in too
SOL’s positive sentiment has rallied to its highest level in 18 months, according to on-chain data provider Santiment on X (formerly Twitter).
? #Altcoins are recovering quickly after the #crypto-wide drop the past couple days. In particular, #Solana has surged back above $71, gaining quickly compared to the majority. Positive sentiment may need to cool down a bit before a serious run, though. https://t.co/yu9F1MgkOw pic.twitter.com/vXbJbN0Kda
— Santiment (@santimentfeed) December 12, 2023
Santiment went on to add that the uptick in the positive sentiment trailing the altcoin has been due to a series of airdrops to be conducted by some of the new projects on Solana network.
In fact, AMBCrypto had reported previously that some Solana-based projects such as Jupiter, Zeta, and Drift, have upcoming airdrops planned.
SOL gains, but there is a catch
The hike in positive sentiment has resulted in a steady uptick in SOL’s price. The coin traded briefly at $74 on 9 December, its highest price point since May 2022.
Although there has been a slight retraction since, the coin still exchanged hands above $70 at press time, data from CoinMarketCap revealed.
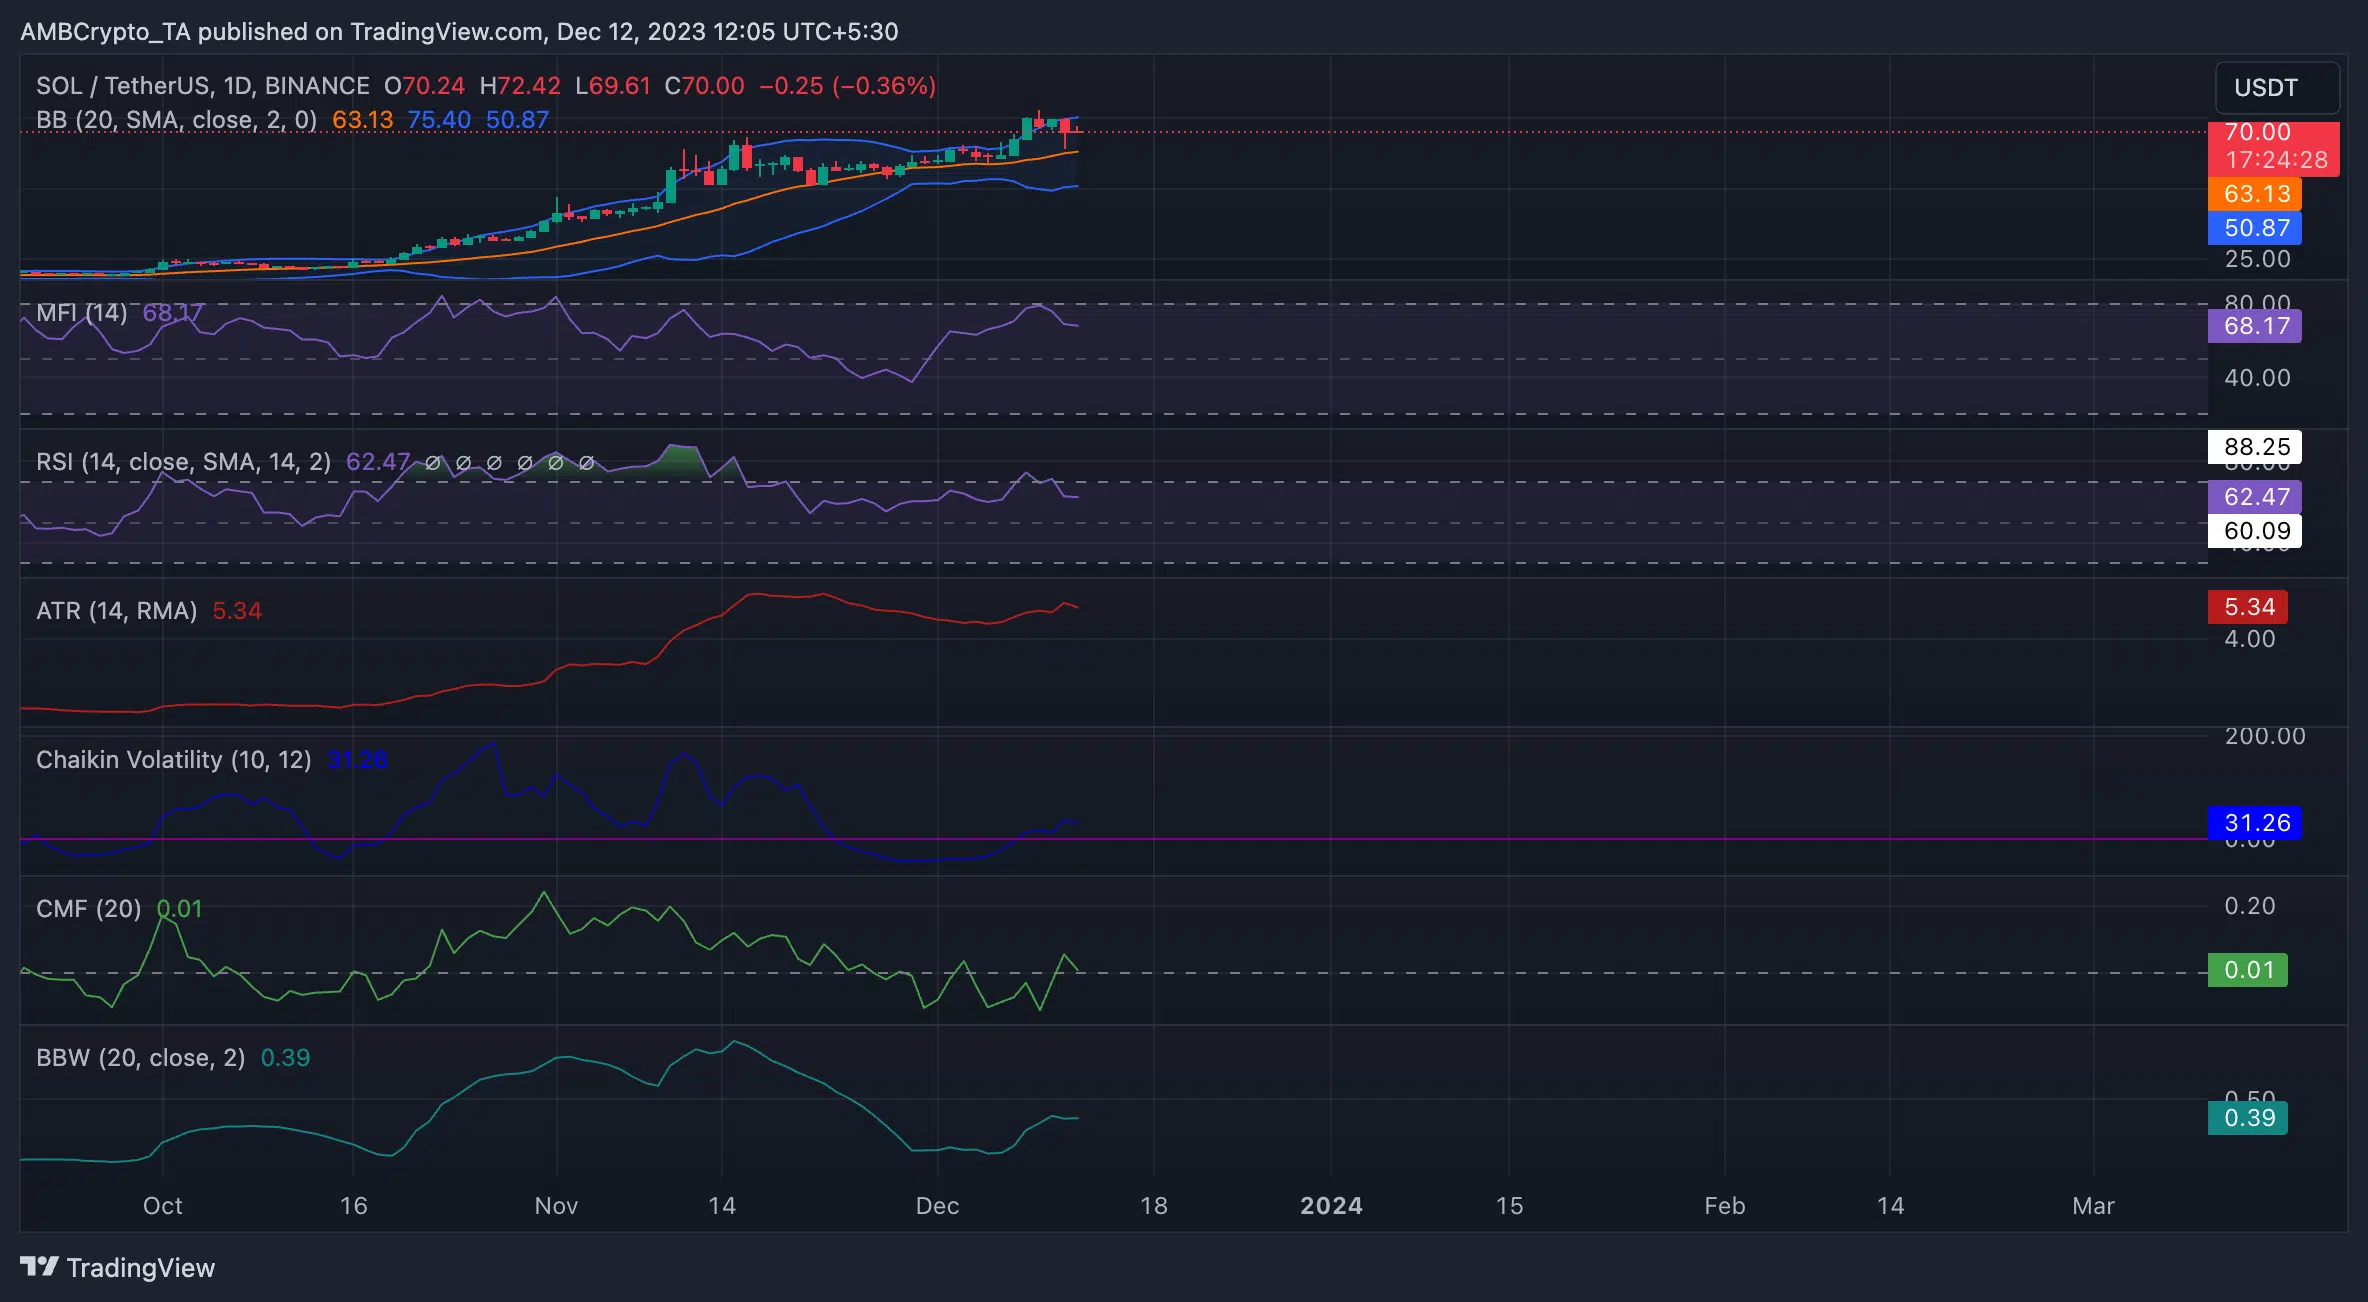
An assessment of the coin’s price movements on a daily chart revealed that coin accumulation persisted among its spot market participants. As of this writing, key momentum indicators were positioned above their respective center lines too.
For example, SOL’s Relative Strength Index (RSI) had a reading of 62.47 while its Money Flow Index (MFI) was 68.17. These values suggested that there is strong buying pressure behind SOL.
Furthermore, SOL’s Chaikin Money Flow (CMF), signaling liquidity inflows, rested above the zero line in the positive zone. A CMF value above zero is typically interpreted as a sign of strength in the market.
Read Solana’s [SOL] Price Prediction 2024-2025
However, the double-digit value surge over the last 30 days has resulted in the re-emergence of market volatility. AMBCrypto assessed SOL’s Bollinger Bands (BB) indicator and found a steadily widening gap between the upper and lower bands of the indicator.
A gradual widening of these bands typically indicates an increase in market volatility. The coin’s Bollinger Bandwidth, which has grown by 105% in the past week, confirmed the rising volatility.
Also, at the time of writing, SOL traded close to the upper band of its BB indicator. When an asset’s price trades this way, traders often interpret it to mean that the asset may be due for a pullback or correction.
Finally, SOL’s Average True Range (ATR), which has climbed by 14% in the last seven days, confirmed the growing volatility. This indicator measures market volatility by calculating the average range between high and low prices over a specified number of periods.


