Ethereum: What $59 million ‘weekly high’ meant for ETH’s long traders
On 9 April, long liquidations totalled $59 million, while short liquidations were less than $7 million on the charts.

- ETH’s price fell briefly, with the altcoin valued at $3470 on 9 April
- Decline in price fueled an uptick in long liquidations
Ethereum’s [ETH] long liquidations closed the trading session on 9 April at a weekly high of $59 million, according to Coinglass data. This occurred despite the recent volatility in the altcoin’s price. In fact, according to CoinMarketCap, ETH was trading at just under $3550 at press time.
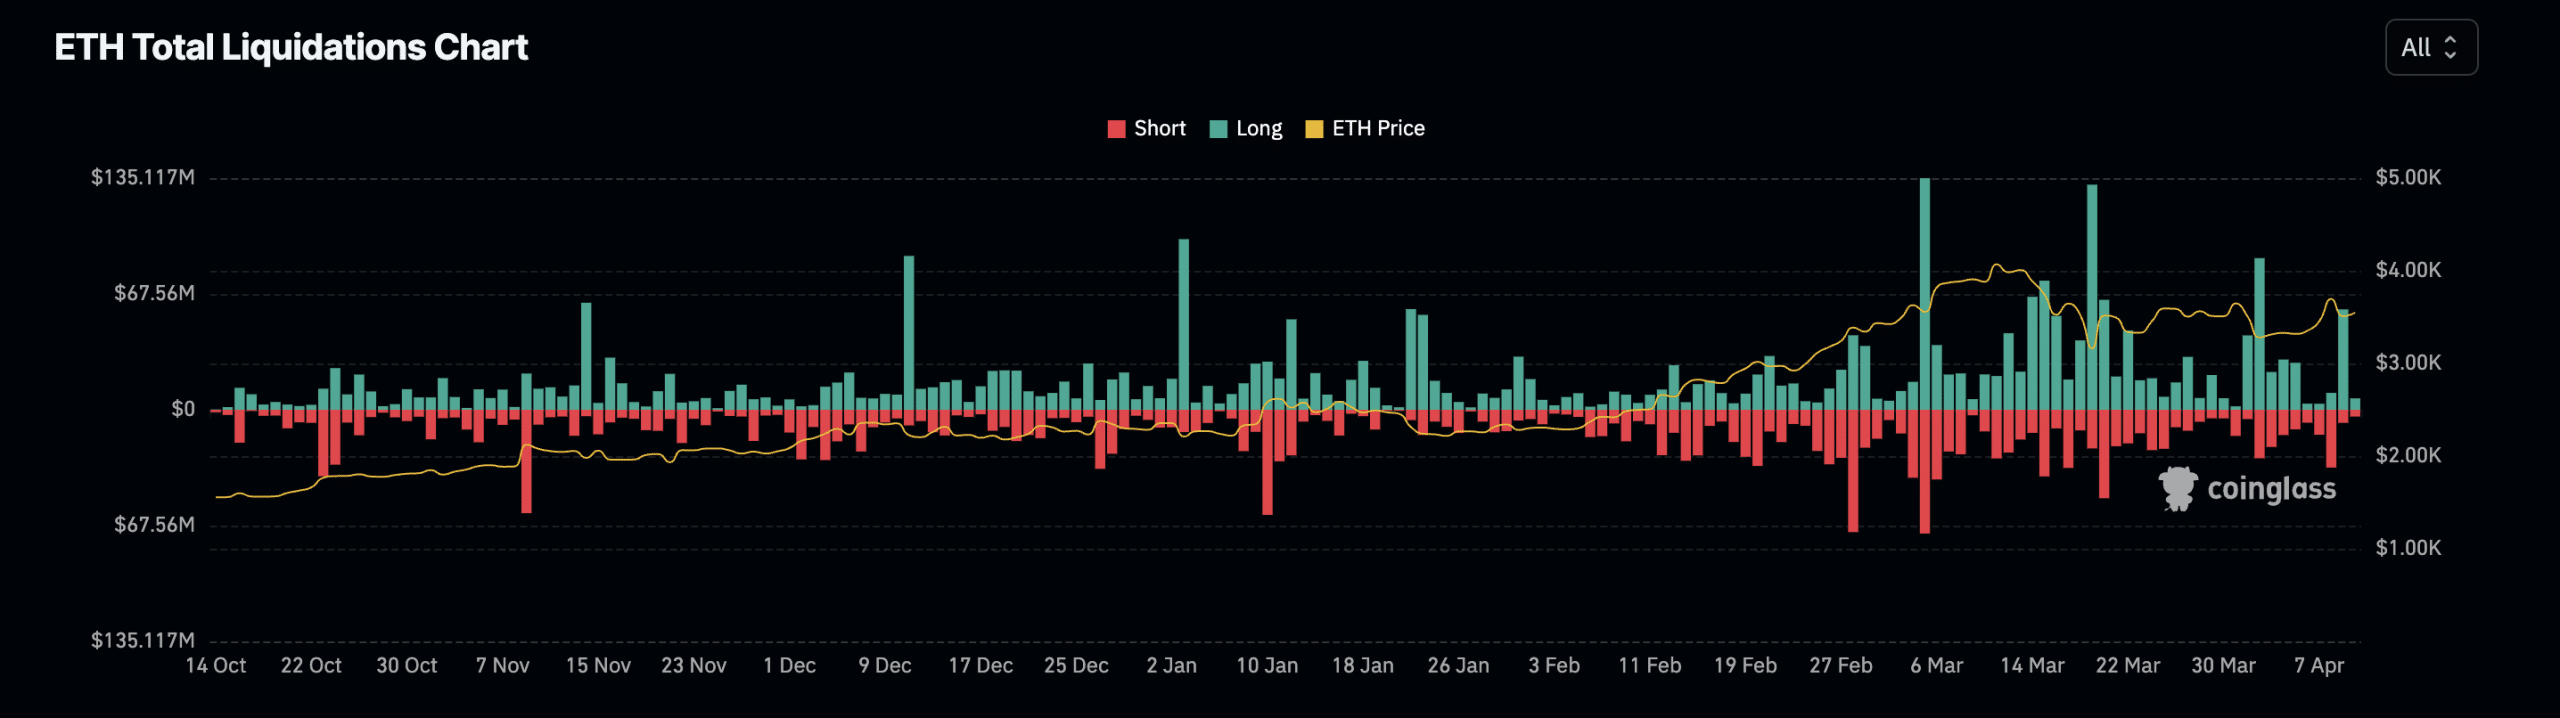
Liquidations happen in an asset’s derivatives market when a trader’s position is forcefully closed due to insufficient funds to maintain it. Long liquidations occur when the value of an asset suddenly drops, and traders who have open positions in favor of a price rally are forced to exit their positions.
In ETH’s case, it recorded a spike in long liquidations on 9 April due to the fall in its price during the intraday trading session. For its part, the altcoin briefly exchanged hands below $3500, before regaining to close the day at $3505.
Soon after, Futures market participants who had placed bets in favor of a price rally were plunged into losses when ETH’s price fell to a low of $3470. On the other hand, short liquidations totalled $7 million, AMBCrypto found.
Bulls’ attempt to displace the bears
While it fell a little over the last 24 hours, ETH’s price rally over the past week mirrors the general uptrend across the cryptocurrency market over that period. In fact, the global cryptocurrency market capitalization has risen by 4% in the last seven days alone.
An assessment of ETH’s performance on the 1-day chart underlined a re-emergence of bullish sentiments.
Read Ethereum (ETH) Price Prediction 2024-25
For example, readings from the coin’s Elder-Ray Index revealed that the indicator has returned only positive values since 8 April. This indicator measures the relationship between the strength of buyers and sellers in the market. When its value is positive, it means that bullish momentum is dominant in the market.
Furthermore, on 8 April, ETH’s MACD line (blue) crossed above the Signal line (orange) to be positioned above zero, at press time.
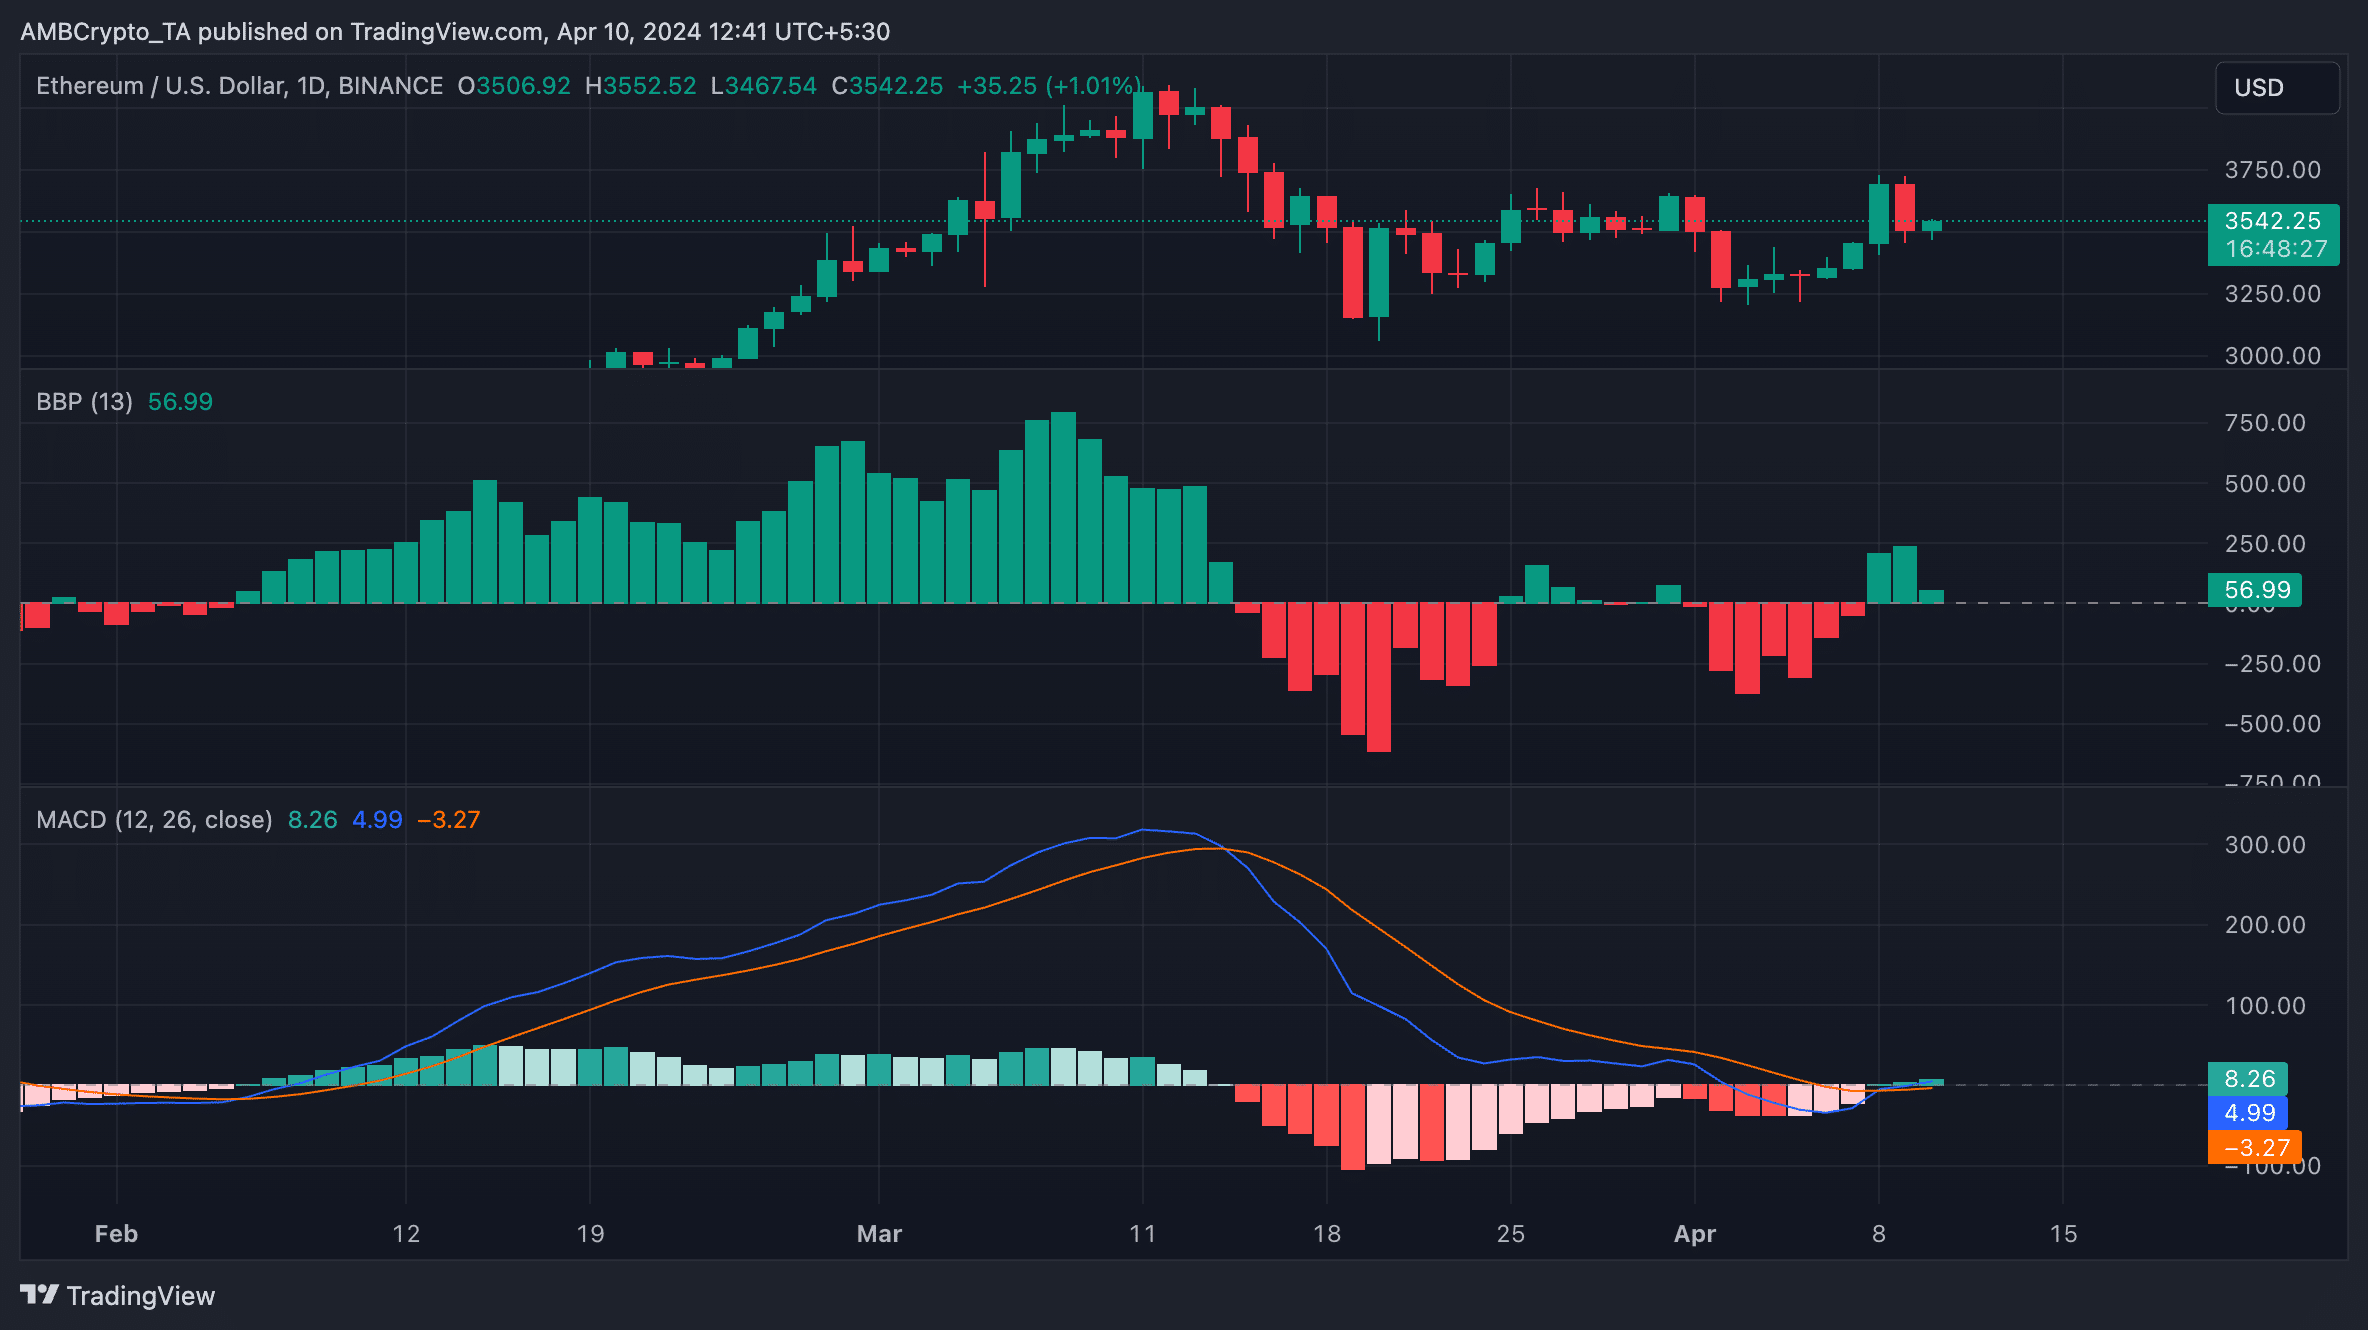
This type of intersection is considered a bullish signal because it indicates that the altcoin’s shorter-term moving average is gaining momentum. This, relative to the longer-term moving average. Traders interpret it as a sign to enter and exit short positions.


