MATIC dives 38% in 4 days – Forget $1, look out for THIS
The Open Interest data showed AMBCrypto that the market sentiment has been bearish throughout April.

- MATIC has a bearish market structure on the one-day chart
- The$0.8-$0.9 region, if revisited, would serve as resistance and could halt the bulls
Polygon [MATIC] witnessed a 38% drop from 9th to 13th April. In the past couple of days, the price attempted to bounce above a key resistance level of $0.73.
AMBCrypto reported that the resistance zone was stiff and MATIC bulls might not have much luck.
This view was vindicated, and the token’s short-term bullishness took a U-turn at $0.751. At press time, the higher timeframe trend was firmly bearish. Investors should be prepared for more losses.
The five-month trendline was broken
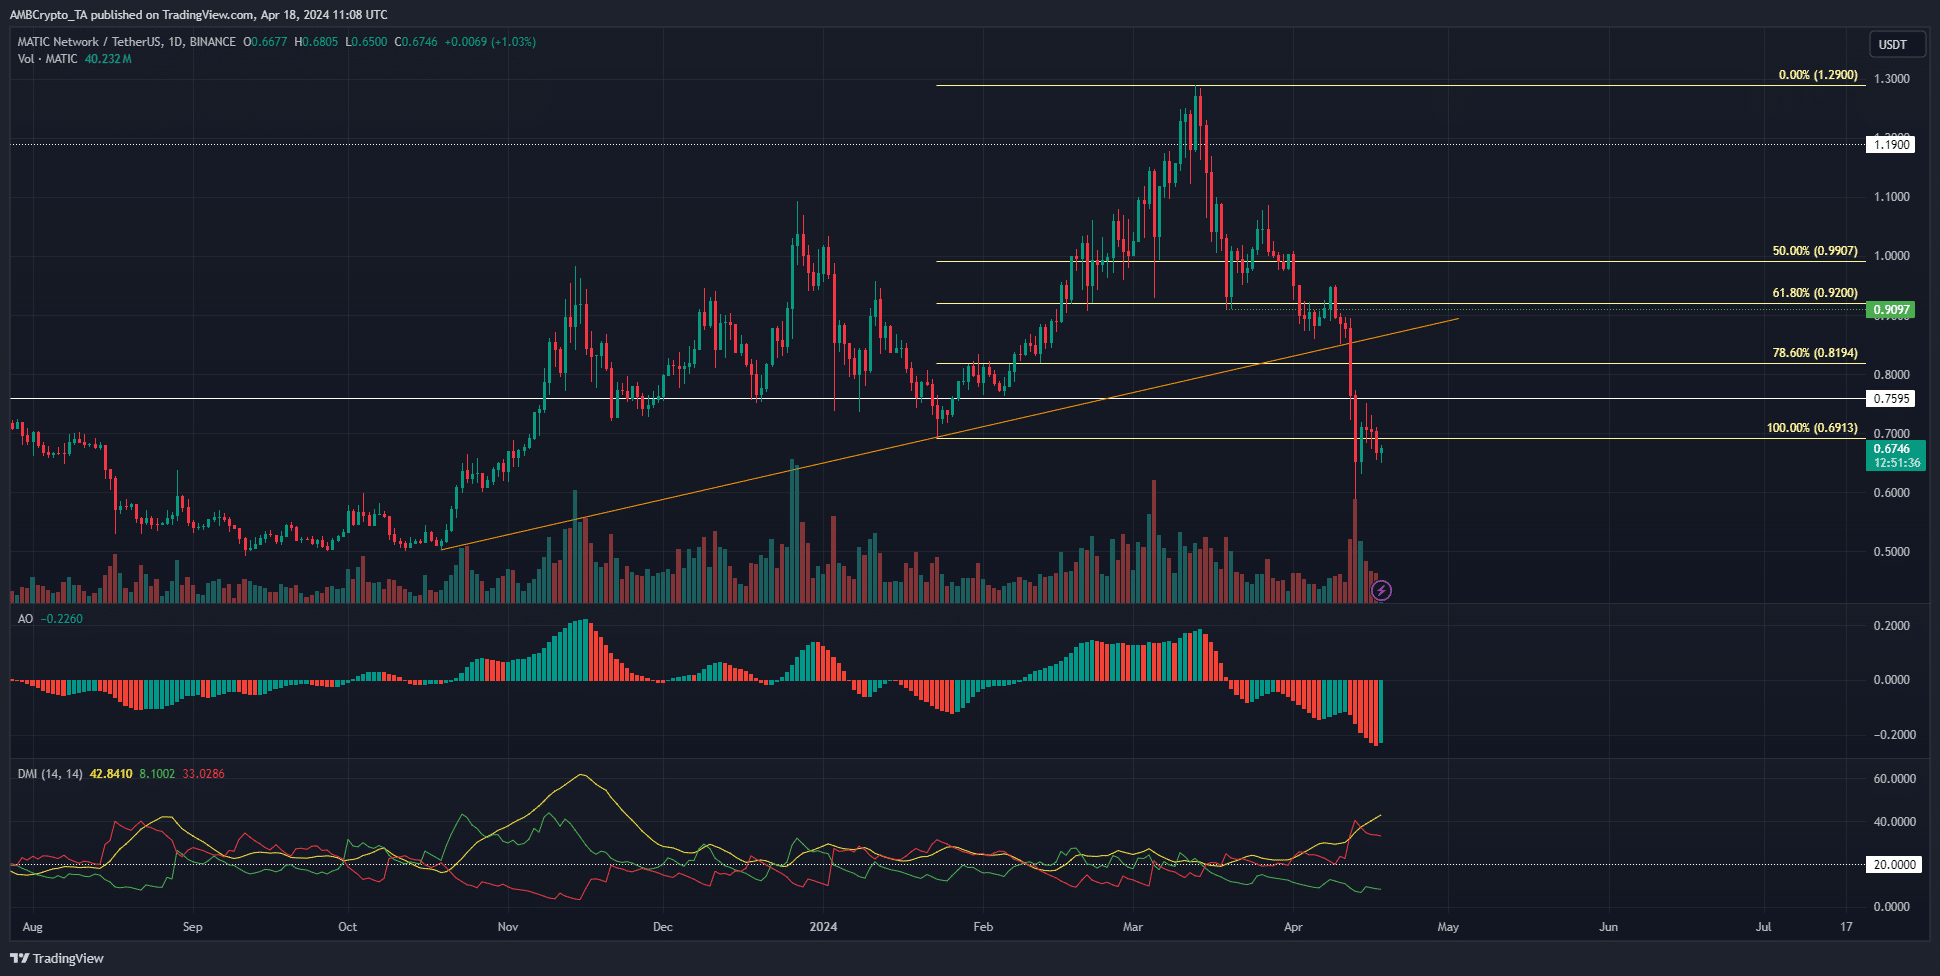
The ascending trendline support from October was breached on the 12th of April. The bears achieved even more and drove prices below the $0.73-$0.75 support zone.
For context, this region has acted as a demand zone since 21st November 2023- nearly five months.
The Awesome Oscillator was at -0.22 and showed intense downward momentum. The Direction Movement Index also showed a strong bearish trend ongoing on the daily timeframe.
Both the ADX (yellow) and the -DI (red) were above the 20 mark.
The price action was also indisputably bearish, on both the daily and the lower timeframes. The move below the $0.69 swing low meant that MATIC is likely headed toward the next support zone at $0.5.
The short-term bounce saw demand flow in
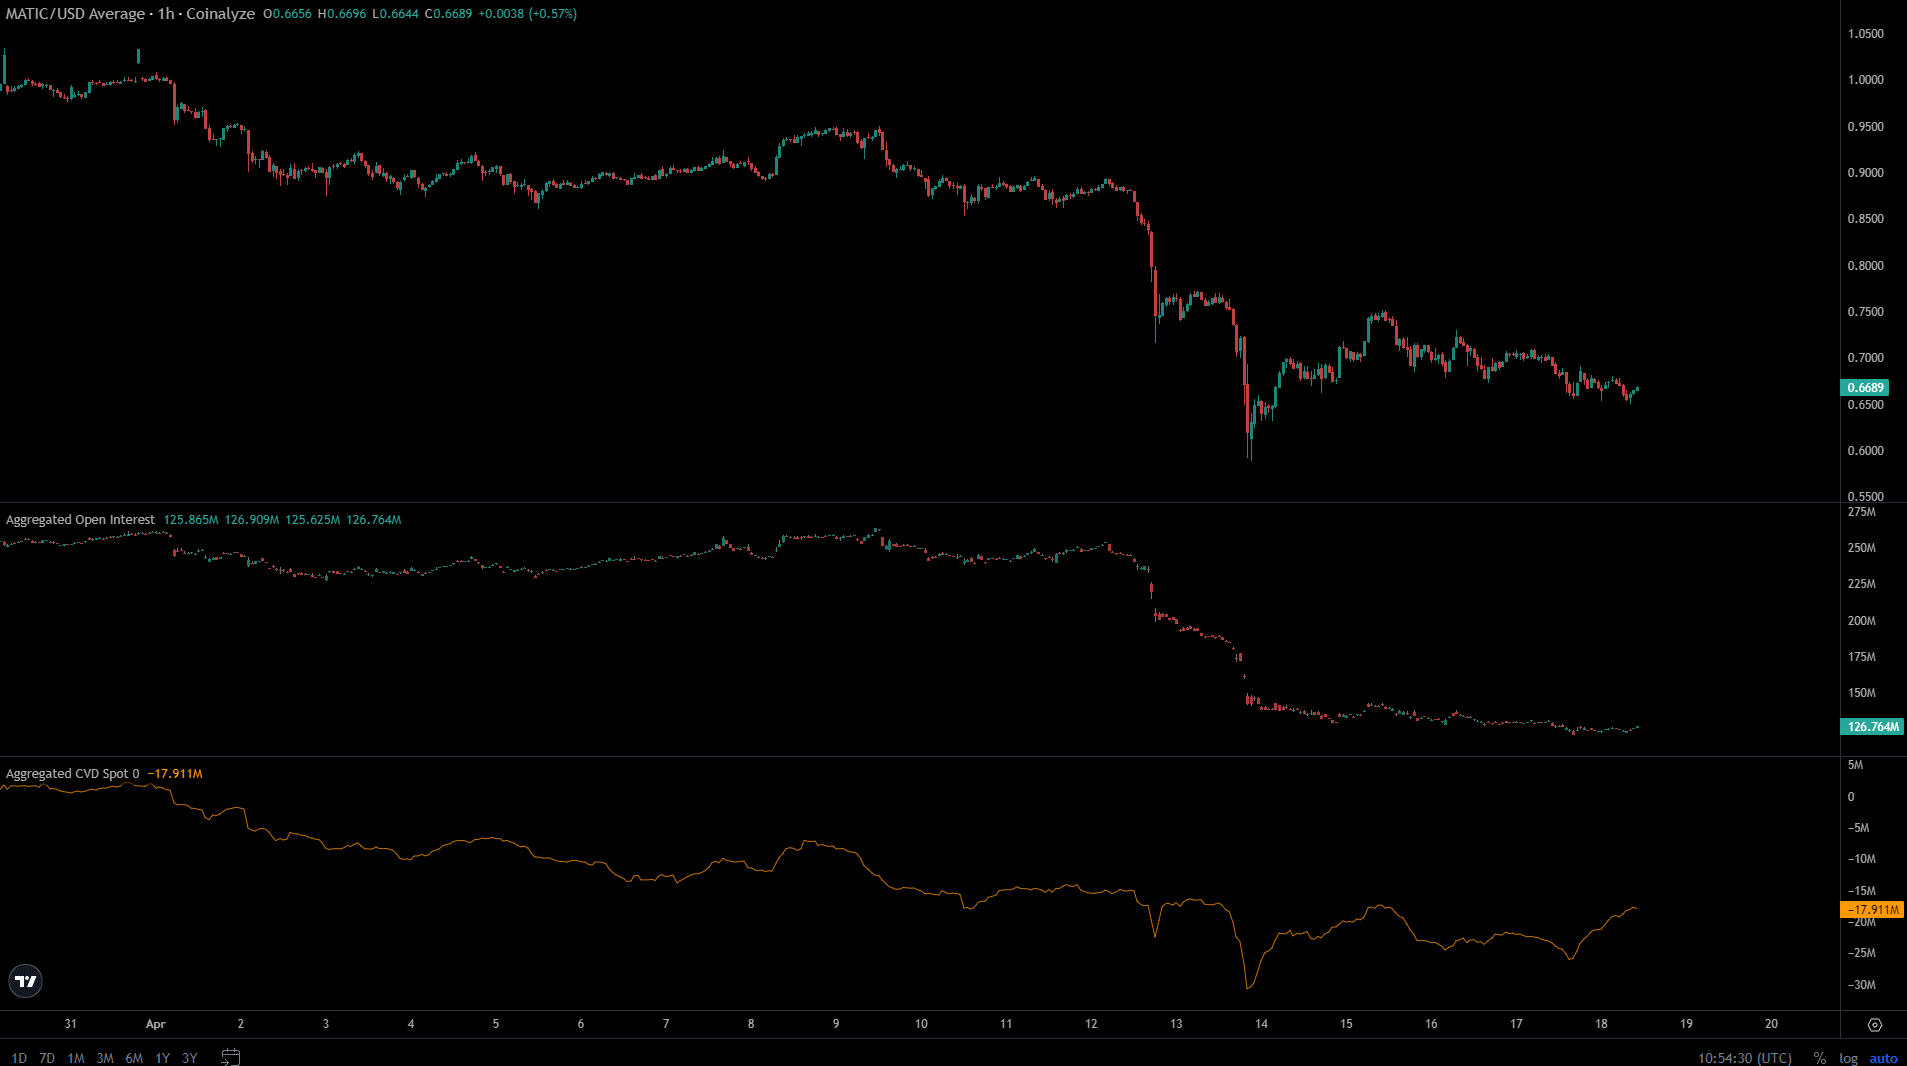
The Open Interest data showed AMBCrypto that the market sentiment has been bearish throughout April. There was some speculative interest in MATIC before the losses began in earnest on the 12th of April.
However, the spot CVD has trended firmly downward in April. Only over the past three days did it show signs of stabilizing. This was encouraging, but was likely not enough to reverse the downtrend.
Read Polygon’s [MATIC] Price Prediction 2024-25
Hence, we can conclude that the short-term demand in the spot market remained fairly weak. It was gaining some strength, but that might not be enough to erase recent losses.
The OI continued to crater as speculators flocked to the sidelines to await an uptrend.
Disclaimer: The information presented does not constitute financial, investment, trading, or other types of advice and is solely the writer’s opinion.


