Injective at risk of pullback as key resistance holds strong – What now?
- INJ bulls might be running out of steam.
- A breakout past $29.68 would be a sign of another impulse move higher, but was unlikely.
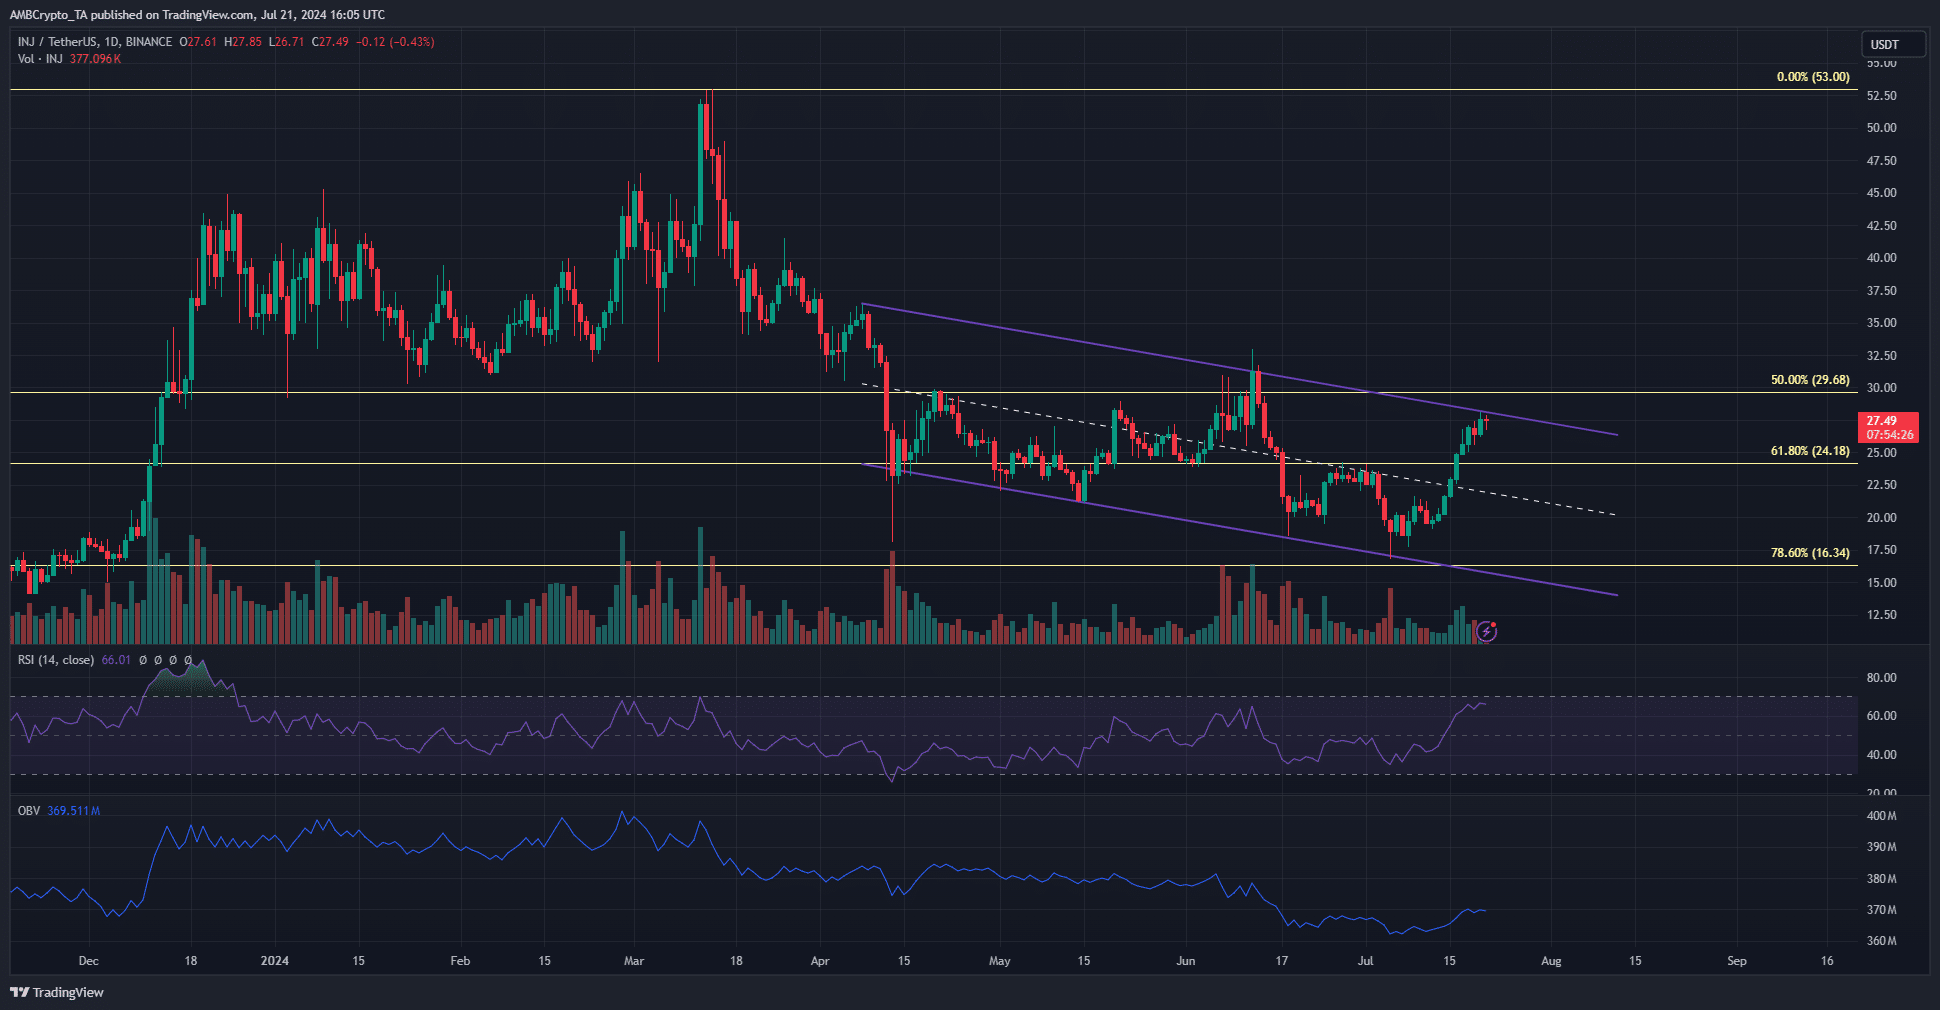
Injective [INJ] was trading at $27.5 and below the 50% Fibonacci level resistance at $29.6. These gains came alongside a Bitcoin [BTC] rally that reached from $57.3k to $67.6k.
Injective traders have reason to expect positive price actions. The move past $24.27 broke this recent lower high and flipped the structure bullishly. This was rewarded with a move to the channel resistance.
Will the descending channel yield in the face of bullish pressure?
On the daily chart, INJ formed a descending channel, marked in purple. It has been in place since early April. At press time, the resistance at $28.2 was being tested. The overhead Fibonacci retracement level could also rebuff the buyers.
While the defense of the $20 zone in the past two months was encouraging, the trend has steadily pointed downward since the losses of the second half of March. The rallies in between that break market structure seem to be lull periods.
The idea that buyers were consistently weak and the price rallies could be liquidity hunts was reinforced by the OBV. The volume indicator continued its downtrend, and a breakout past the range highs was unlikely.
To the south, the $24.18 and the mid-channel mark at $21.5-$22 region are the two levels that could see a price bounce if prices are rebuffed from the $27.5 territory.
Accumulation signals are in place but Injective traders must beware of this
Source: Santiment
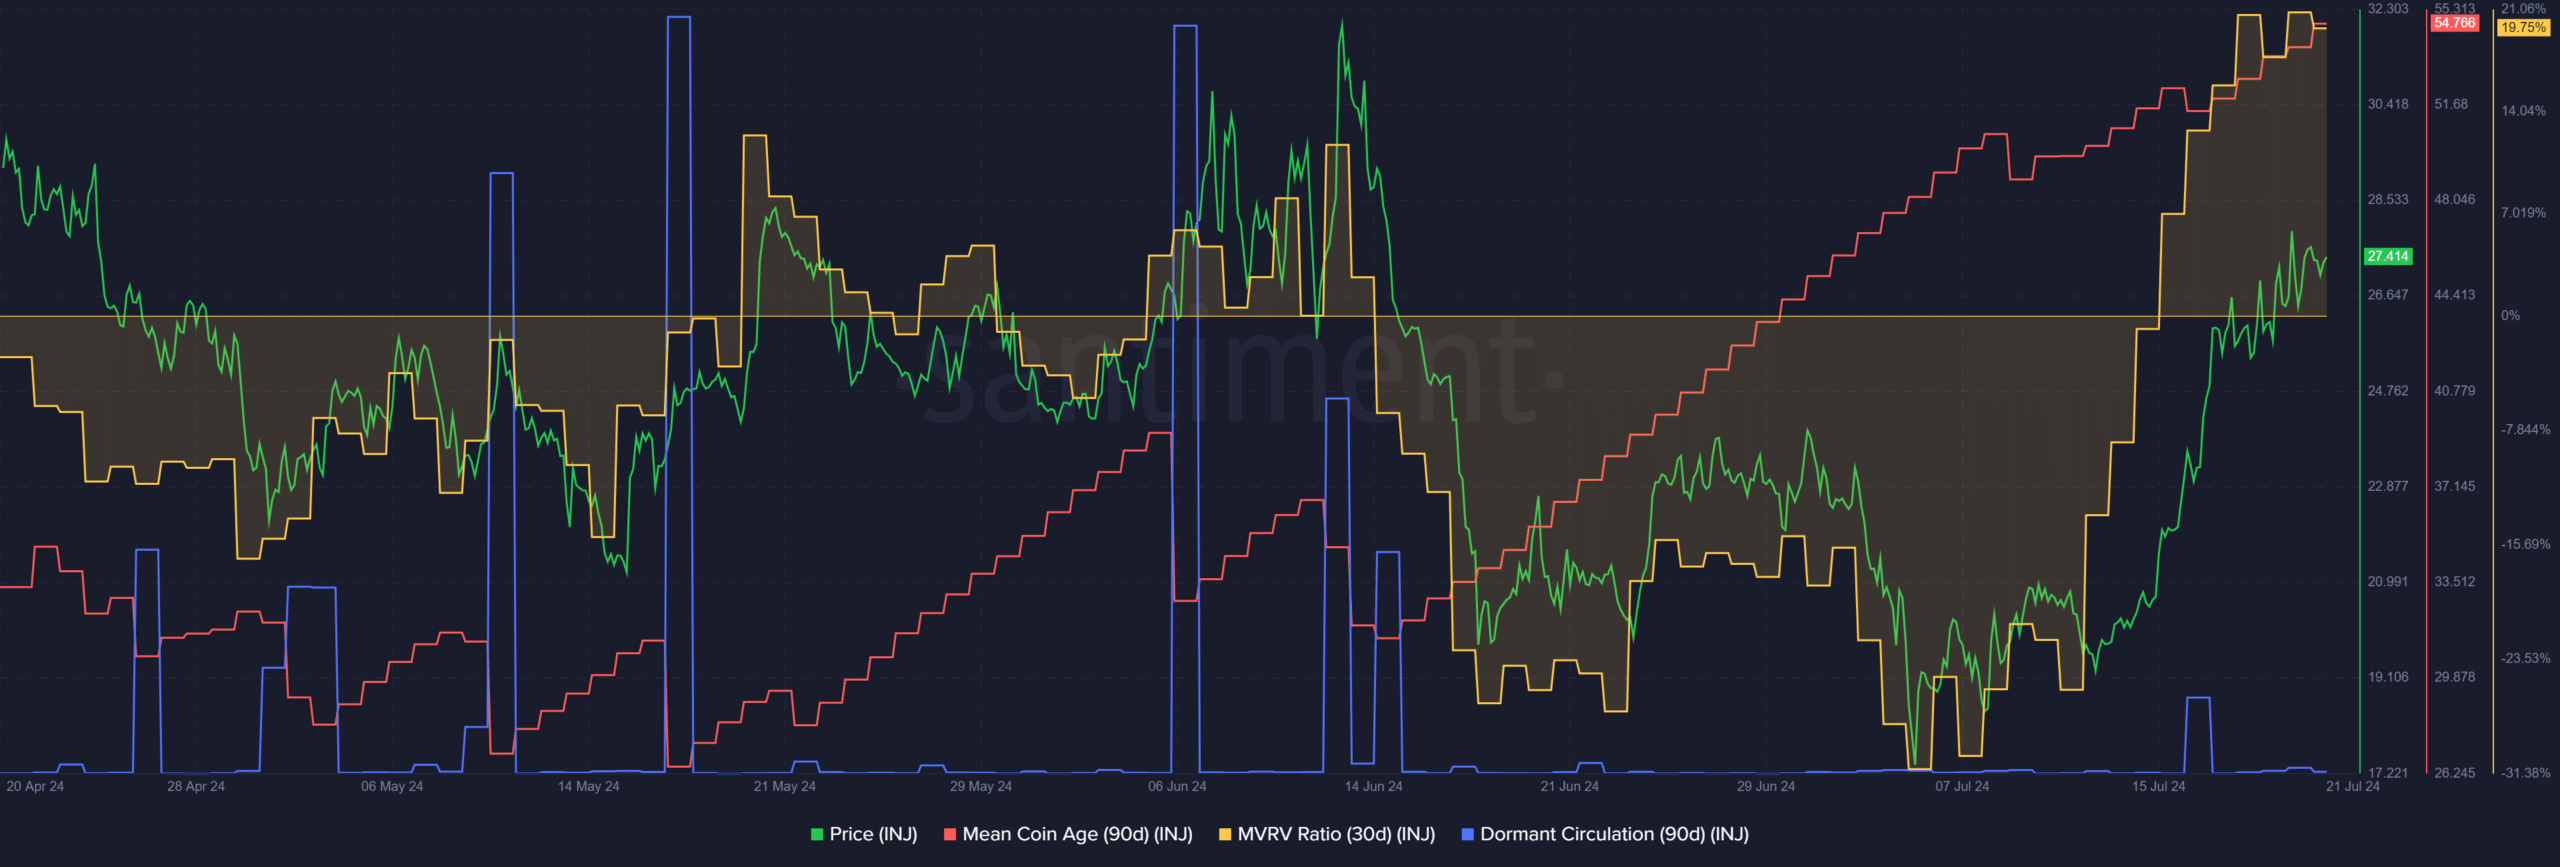
The 30-day MVRV ratio was at +19.75% to show short-term INJ holders had amassed a sizeable profit. In turn, this could lead to a wave of selling shortly. On the other hand, the rising mean coin age signaled network-wide accumulation.
The dormant circulation has also been relatively low since mid-June. A sharp uptick in this metric would presage a wave of selling.
Source: Coinalyze
Realistic or not, here’s INJ’s market cap in BTC’s terms
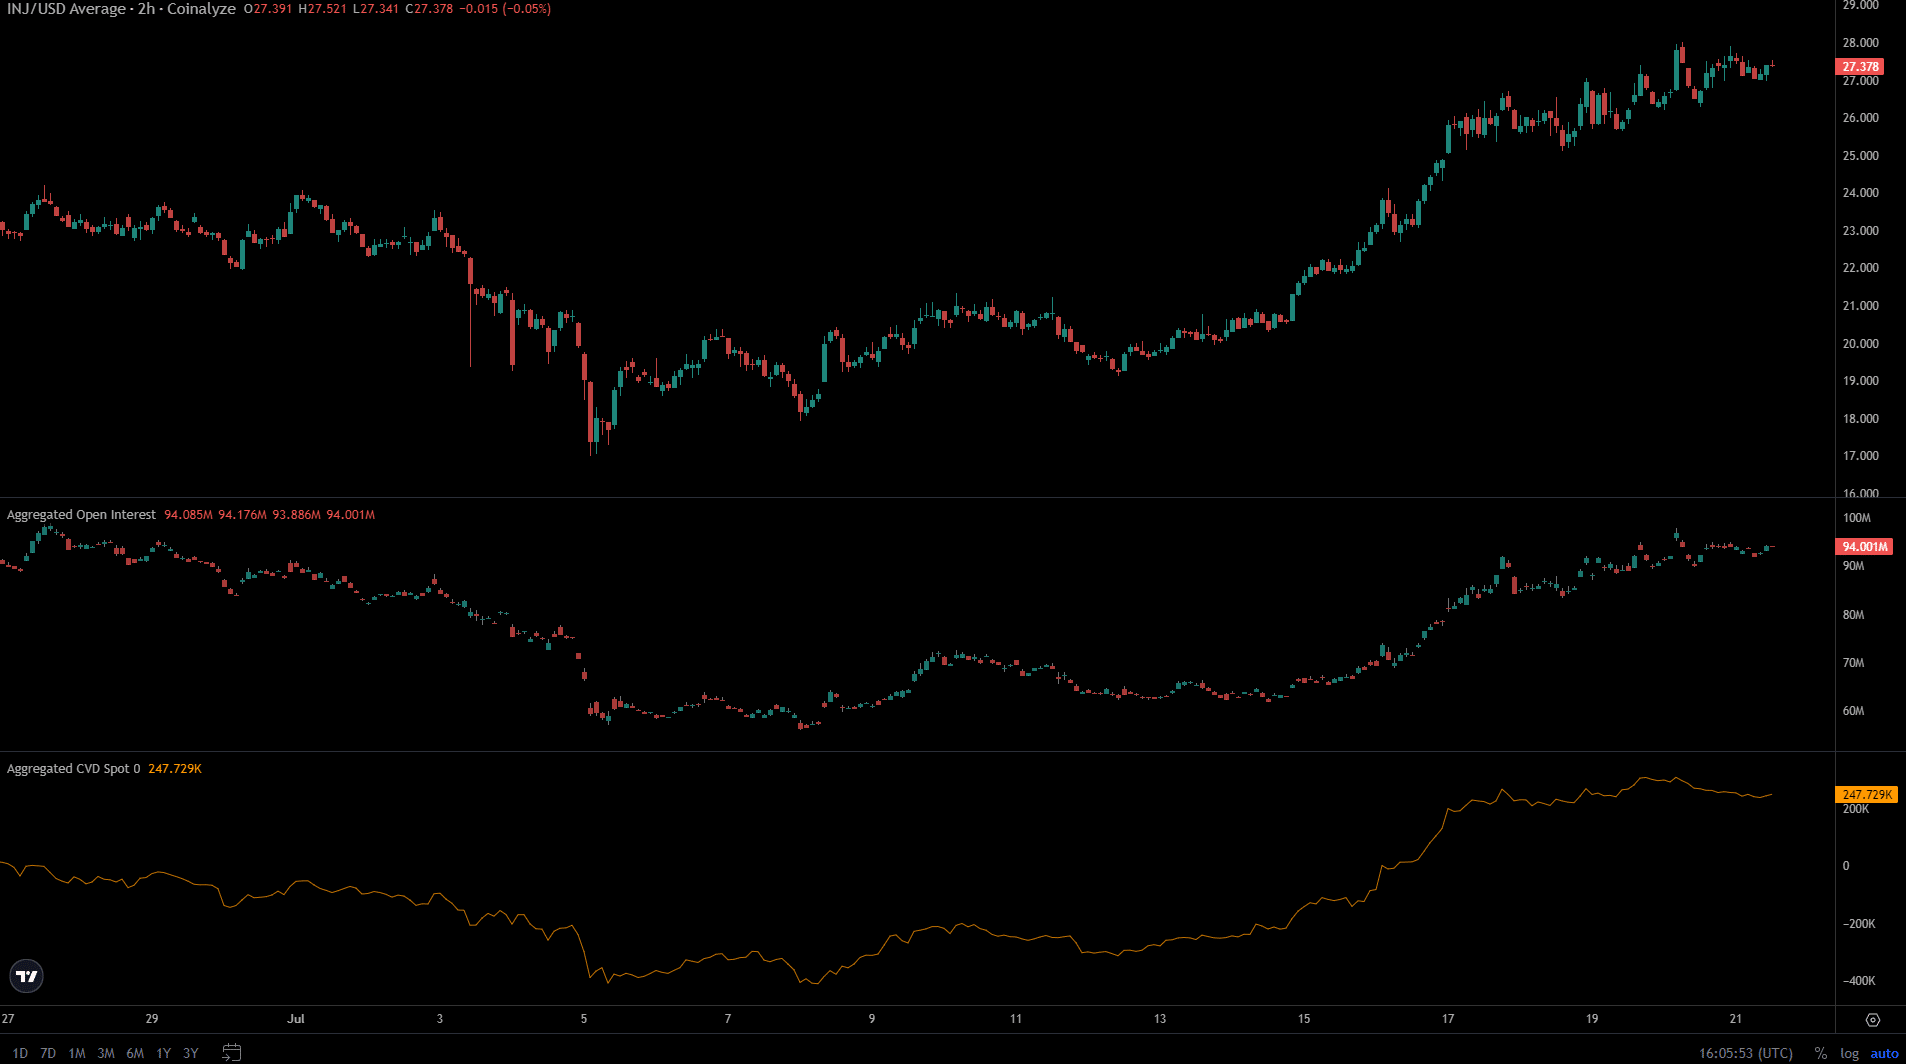
The Open Interest was still in an uptrend but has slowed down since the 17th of July. The spot CVD has also stalled in the past four days. Together they showed the buying pressure has eased up.
Despite the accumulation signal, the weakening short-term sentiment and demand hinted that a pullback could arrive soon.

