Pepe analysis: Is now the time to hold or sell amid recent rally?
PEPE moving above the 50DMA was another sign that the long-term momentum is shifting bullishly.

- The strong momentum and buying pressure should eventually force PEPE past the July highs.
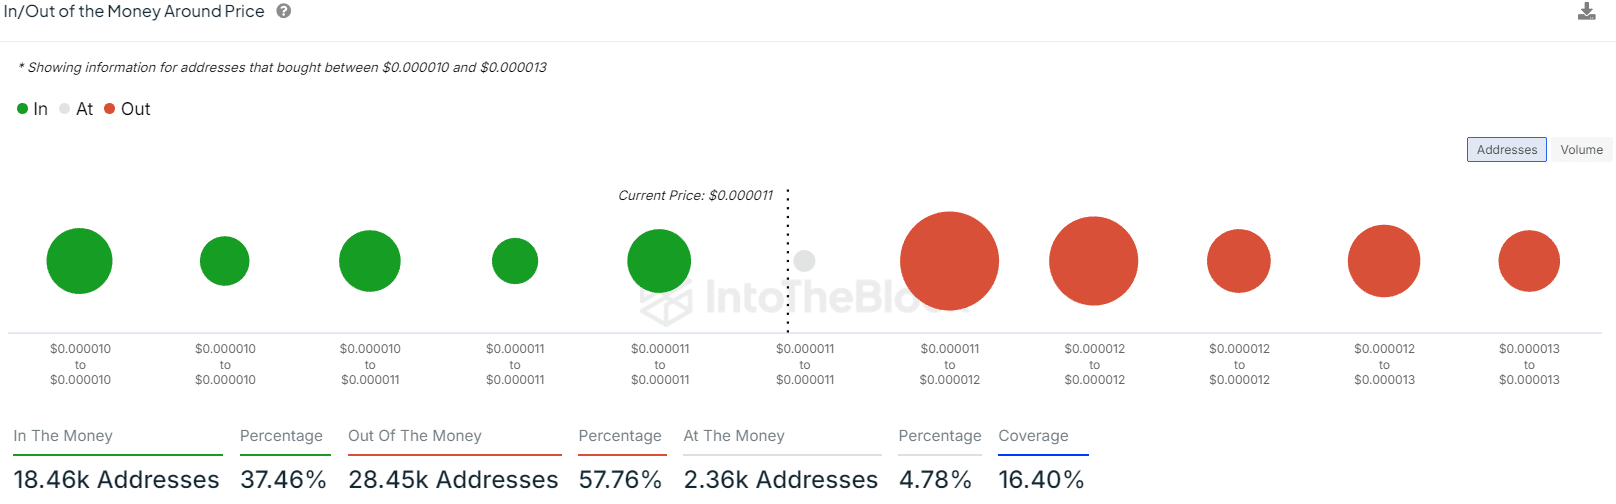
- In/out of the money data showed that this resistance zone was particularly strong.
Pepe [PEPE] was one of the dozens of popular altcoins that broke out of a multi-month consolidation and range-bound trading. Since August, the third-largest meme coin has struggled to break the $0.000009 resistance convincingly.
A 58% upward move over the past two weeks, coupled with a bullish market structure break, will hearten PEPE holders. Should they take profits and wait for the next move, or continue to hold on in anticipation of a continued rally?
PEPE sees a minor price dip after nearing a three-month resistance
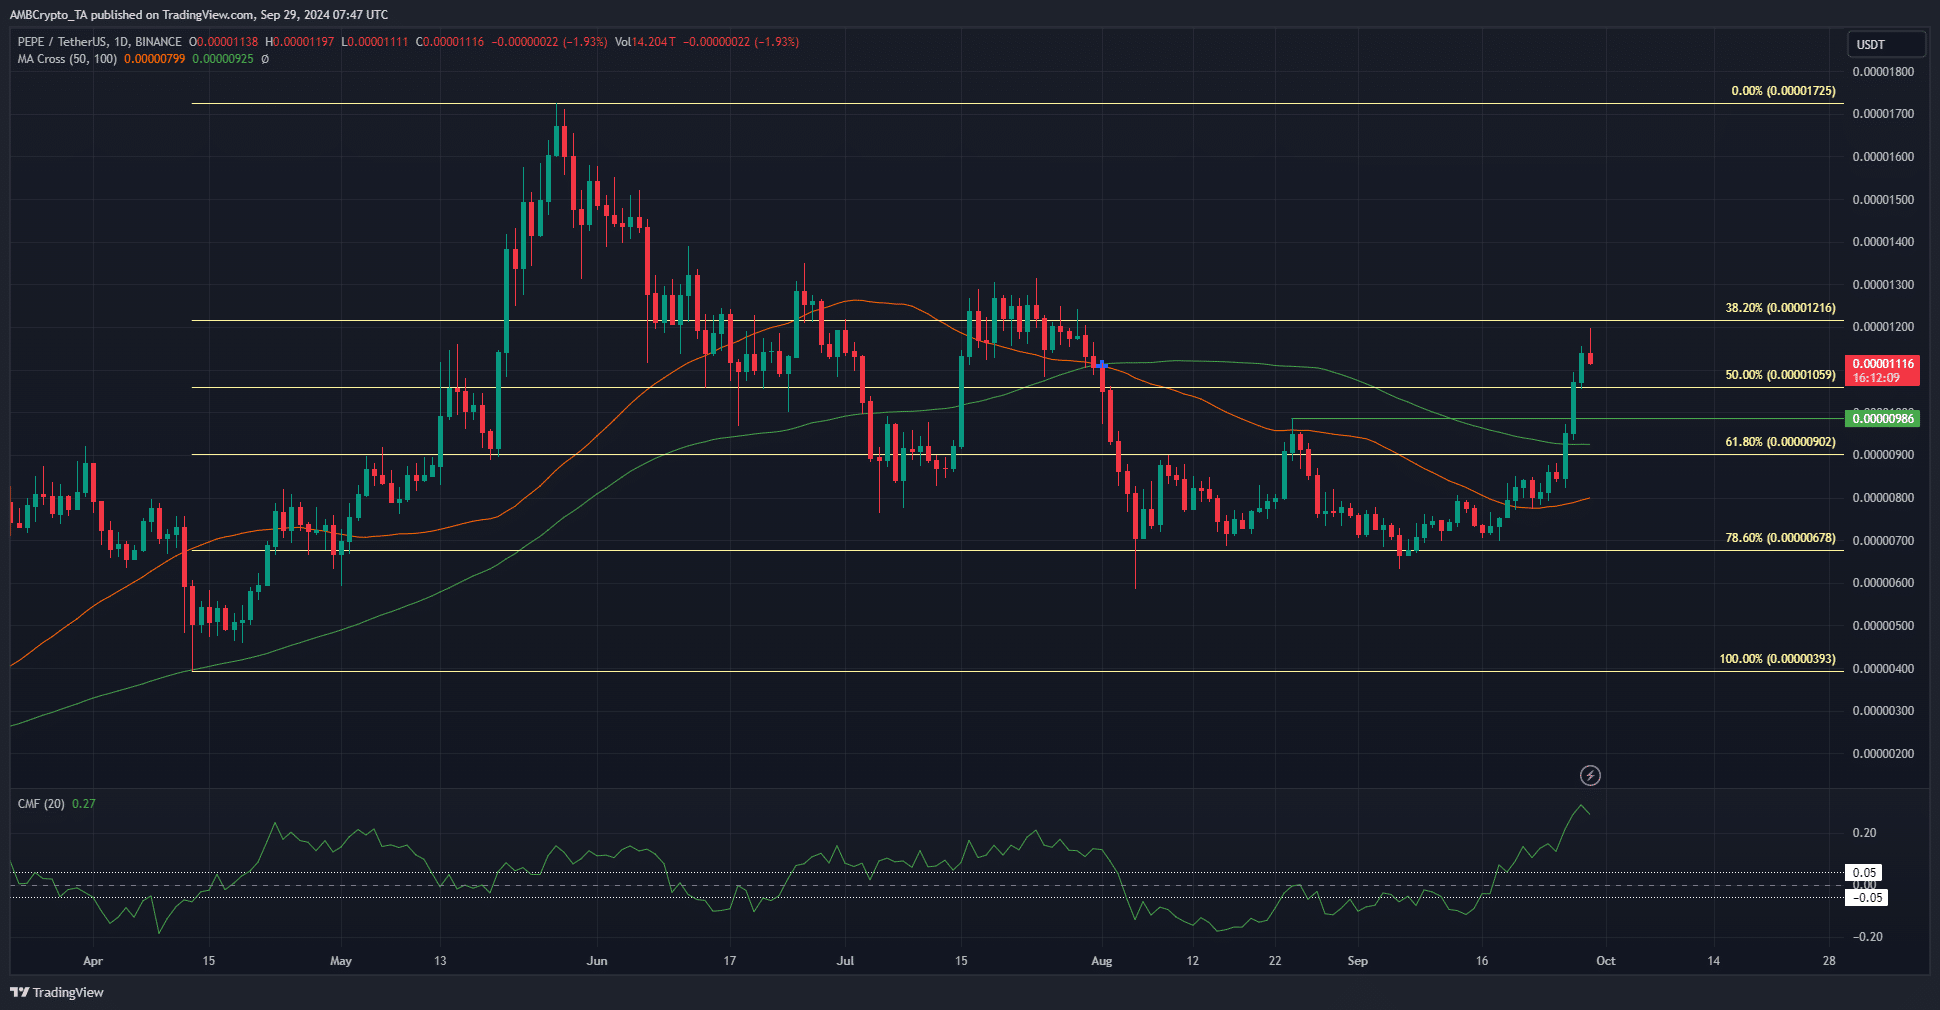
The weekly chart showed that if Sunday’s trading session closes above $0.00000986, it would flip the weekly structure bullishly. The daily structure was bullish and has been since the 20th of September.
The 78.6% Fibonacci level was defended, and the rally toward the June and July highs was a refreshing sight. A rejection from the $0.0000123-$0.000013 zone is still possible. Hence, swing traders already in a position should consider taking partial profits at least.
The CMF was at +0.27 to highlight the heavy buying pressure of the past two weeks. PEPE moving above the 50DMA was another sign that the long-term momentum was shifting bullishly.
Psychological resistance has been flipped
The $0.00001 round number is a psychologically important level. At press time the meme coin was trading above this level and the high buying pressure meant that it was likely that it would be converted to a support zone.
Read Pepe’s [PEPE] Price Prediction 2024-25
The data from IntoTheBlock showed that the $0.000011-$0.000012 is a large resistance zone. A lot of addresses bought the token in this price range and some might be tempted to sell after the lack of bullish movement since June.
Disclaimer: The information presented does not constitute financial, investment, trading, or other types of advice and is solely the writer’s opinion