Will Bonk Coin surpass July’s high in October? Technical indicators suggest…
The RSI was at 73, but it risked forming a bearish divergence if it fails to climb past 74.69 in the coming days.

- BONK has a strongly bullish short-term outlook.
- The potential for a bearish divergence could see volatility and a price dip in the coming days.
Bonk [BONK] was one of the popular meme coins that held up well while the majority of the market experienced increased sell pressure. BONK also saw a large short-term dip, but the bulls were quick to buy it.
This influx of buying saw Bonk coin regain 10.8% after the dip. A resistance level that has not been breached since July stood in the way of the bulls- will they clear this level soon?
Range breakout and retest boosts bullish hopes
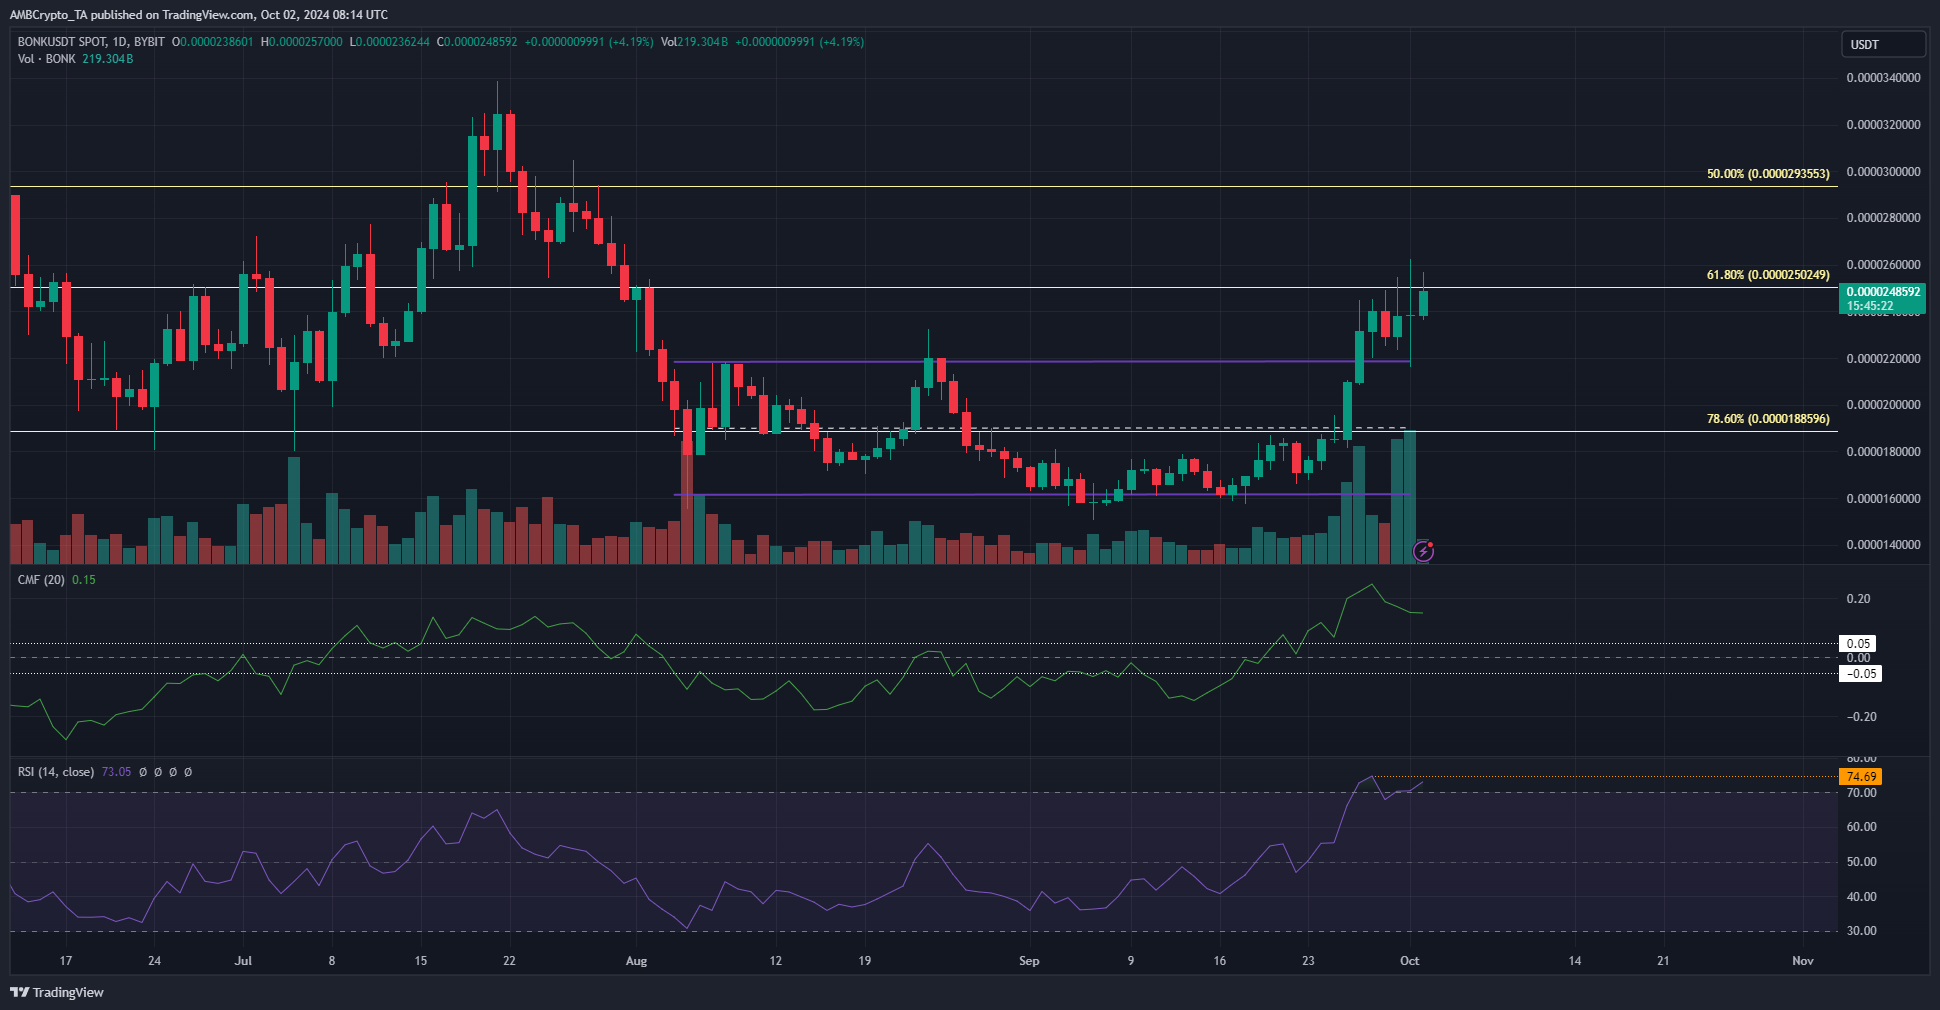
Bonk coin showed remarkable strength despite the market-wide price drop in the past three days. This panic selling saw BONK retest the former range highs and continue its uptrend.
At press time the token was trading at $0.0000248, just beneath the $0.000025 resistance level.
Despite the strong bullishness of Bonk coin in recent weeks, it should be remembered that the higher timeframe trend is downward. This is exemplified by the Fibonacci retracement level resistances at $0.000025 and $0.0000293.
The RSI was at 73, but it risked forming a bearish divergence if it fails to climb past 74.69 in the coming days. If this happens it could be an early signal of a local top and an impending retracement.
Liquidation heatmap shows upside target
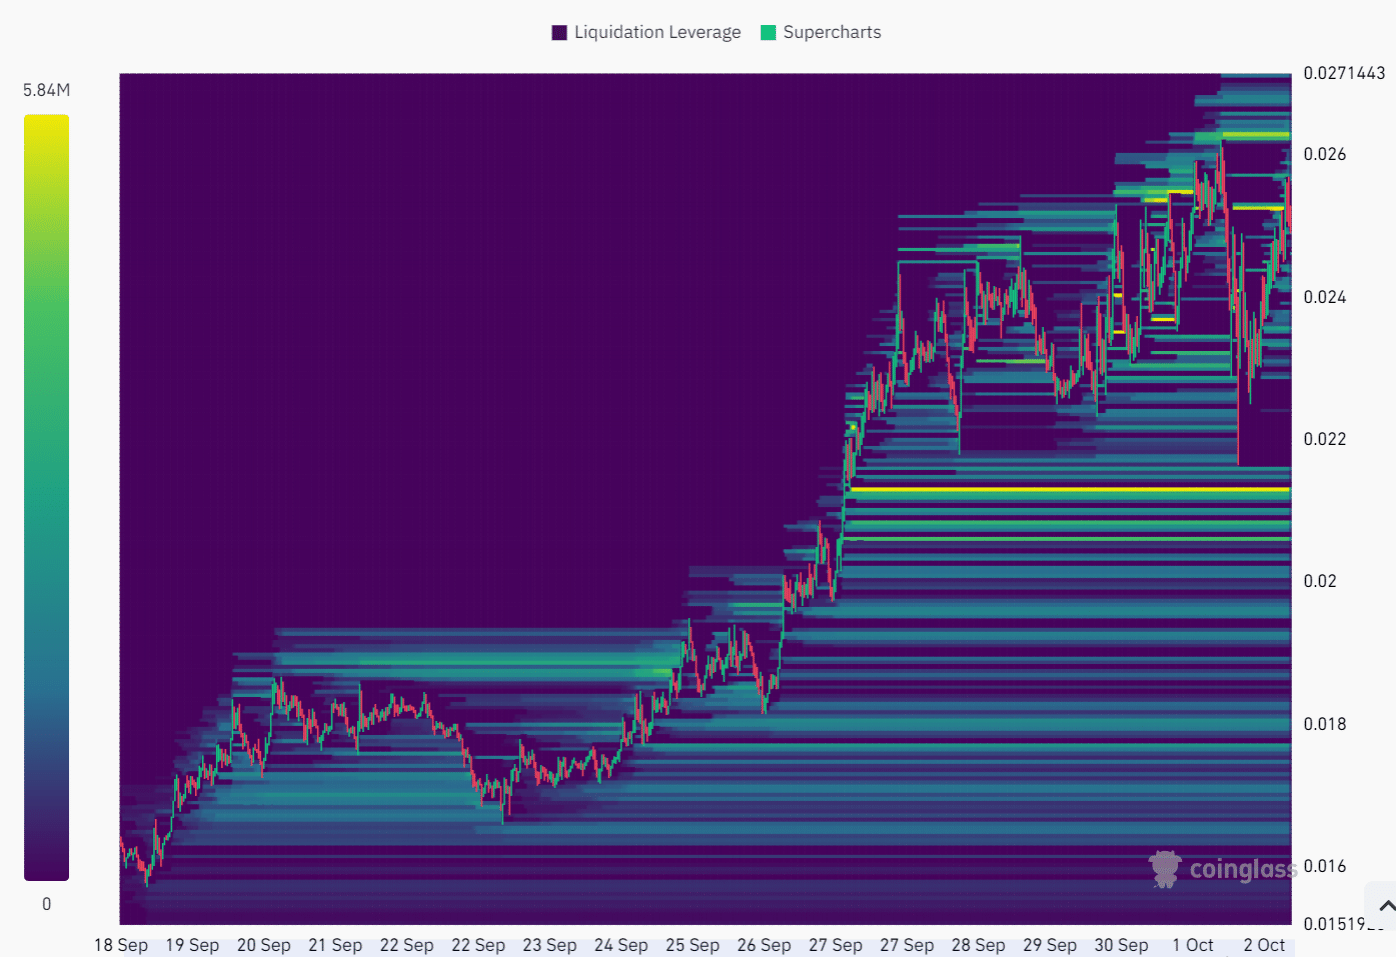
The liquidation heatmap of the past two weeks showed that the $0.0000263 zone is the next short-term target for Bonk coin. The technical indicators were strongly bullish and the recent volatility that rocked the market did not affect BONK too badly.
Realistic or not, here’s BONK’s market cap in BTC’s terms
While unlikely, in the case of rejection at $0.0000252 and a short-term downtrend, the $0.0000211 is the next magnetic zone of interest to the south.
AMBCrypto’s analysis showed that a move toward and past the $0.0000263 is the expectation for this week.
Disclaimer: The information presented does not constitute financial, investment, trading, or other types of advice and is solely the writer’s opinion