Bonk [BONK] is a Solana-based memecoin; one of the most recognizable social-layer tokens in the Solana ecosystem. It launched in late 2022, at a time when Solana’s community sentiment was under pressure after the collapse of FTX.

Unlike many memecoins that begin and end with internet culture, BONK was built around distribution. The original token documentation said the project was a response to predatory VC tokens, making BONK a way to return attention, ownership, and participation to Solana users. The token was issued as an SPL token on Solana, allowing it to benefit from the network’s low transaction costs and active retail trading culture.

BONK does not have a traditional founder-led identity. In fact, its early documentation referred to multiple early contributors. Public ecosystem figures such as Nom have become closely associated with BONK’s growth, but the identity for the most part is community-led.

What’s important about BONK is that it has become a kind of cultural bridge inside Solana. For many users, BONK is not just a token that they trade; it is one of the assets that represents Solana’s post-FTX recovery story and its builder-first community. It has a somewhat different role than other short-lived memecoins because BONK is tied to a wider network of wallets and trading bots.

The most important part of BONK’s early design was its airdrop. Half of the original 100 trillion token supply was allocated to the Solana community. This included Solana NFT projects, DeFi users, market participants, 1/1 artists and collectors, and developers building on the network. The remaining allocation was set aside for early contributors, BONK DAO initiatives, liquidity, marketing, and future ecosystem development. 

At the time of writing, BONK had about 1.1 million holders and over 400 integrations. Projects such as BONK Swap, BONK Rewards, BONK.fun, BONK Live, BONK Trade, and BonkX are proof of how the ecosystem has expanded into DeFi, token discovery, rewards and consumer finance.

BONK.fun has become especially important, because it ties BONK to Solana’s memecoin launchpad economy. Here, what’s interesting is that it gives the token an activity layer that many memecoins lack – Usage across trading tools and launch infrastructure.

The BONK DAO also plays an important role in keeping the ecosystem active. The DAO structure allows BONK-aligned initiatives to support integrations, community campaigns, ecosystem grants and product experiments. With this, BONK has tried to solve the memecoin utility problem by becoming useful across different parts of Solana’s app layer.

Coming to traditional access points – In 2025, Bitcoin Capital launched a physically-backed BONK ETP on the SIX Swiss Exchange, giving eligible investors a regulated way to access BONK through brokerage accounts. Safety Shot also rebranded to Bonk, Inc. and began trading on Nasdaq under the ticker BNKK.

Going forward, BONK’s key milestones will primarily be about whether its ecosystem can keep expanding. Areas to watch include BONK.fun activity, BonkBot usage, rewards participation, new Solana integrations, public-market products, and consumer-facing apps such as BonkX. 

VIEW MORE

Overview

Market Cap
$331.02M
-4.2%
Volume (24H)
$35.69M
Volume (7D)
$242.89M
-11.6%
Max Supply
87,995,282,867,001 BONK
Circulating Supply
87,994,604,042,989 BONK
All-Time High
$0.000058
-93.6%
All-Time Low
$0
+4,259.3%
(above ATL)

Prediction Analysis

Current Price
$0.00
Sentiment
Bearish
50-Day SMA
$0.00
Price Prediction
$0.00
-73.40%
Fear & Greed Index
200-Day SMA
$0.00
Green Days
10 / last 30 (34.5%)
Volatility
4.38%
Moderate
14-Day RSI
43.57
Neutral

Profit Calculator

Select asset
%
%
Total Profit
$0
(0%)
Total Exit Amount
$0
Total Investment Fee
$0
Total Exit Fee
$0

Bonk Price Prediction

Current Price
$0.00
2031
$0.00
2036
$0.00
2041
$0.00
2046
$0.00

Results are based solely on your predicted price change. They are not indicators of future performance and do not take into account different performance scenarios, historical data, or the effect of fees or other charges.

VIEW MORE

Short-Term Bonk Price Targets

Date Prediction Change
Jul 15, 2026 $0.00 -1.55%
Jul 16, 2026 $0.00 -3.07%
Jul 17, 2026 $0.00 -4.57%
Jul 18, 2026 $0.00 -6.04%
Jul 19, 2026 $0.00 -7.49%
Jul 20, 2026 $0.00 -8.93%
Jul 21, 2026 $0.00 -10.33%

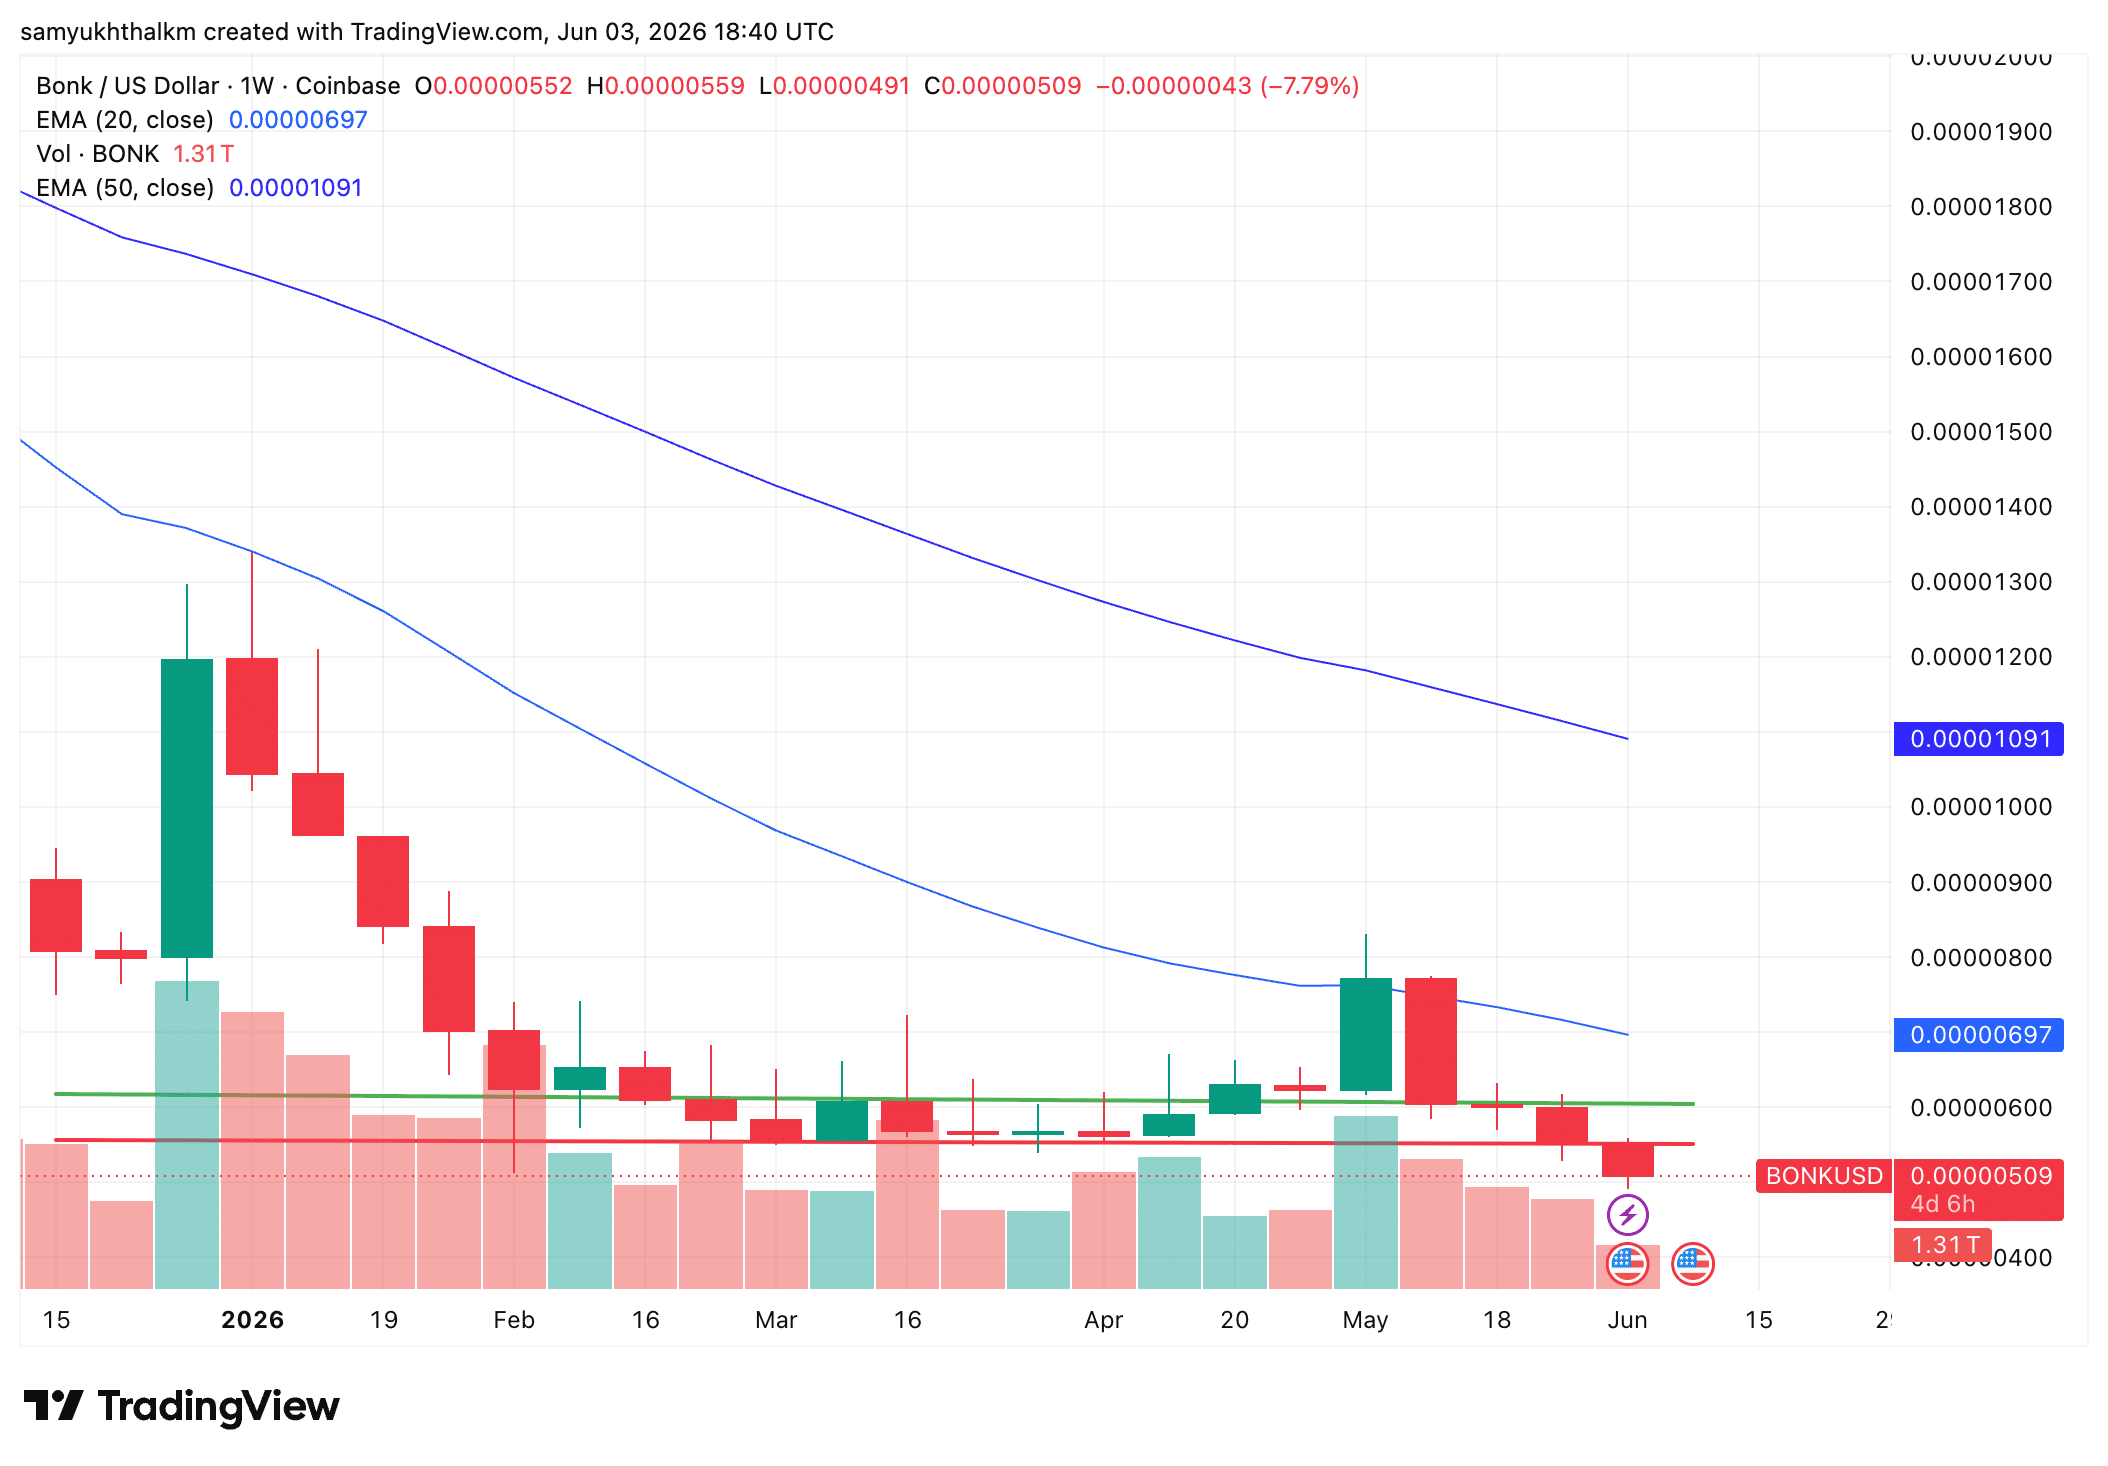
BONK’s short-term outlook will be doubtful as long as it trades below the 20-week EMA near $0.00000697. The altcoin was testing the $0.00000490-$0.00000510 support zone in June 2026, which seemed to be the most important area for buyers to defend. If this level holds, BONK could attempt a recovery. However, a breakdown below $0.00000490 would worsen things and could push the token south.

VIEW MORE

Monthly Bonk Price Prediction

Jun 30, 2026
$0.00
Jul 14, 2026
$0.00
Highest in Jul
$0.00
Lowest in Jul
$0.00
Overall Performance
Falling

Long-Term Bonk Price Prediction

Month Price AVG Price Max Price Change
Jul $0.00 $0.00 $0.00 -100.00%
Aug $0.00 $0.00 $0.00 -100.00%
Sep $0.00 $0.00 $0.00 -100.00%
Oct $0.00 $0.00 $0.00 -100.00%
Nov $0.00 $0.00 $0.00 -100.00%
Dec $0.00 $0.00 $0.00 -100.00%
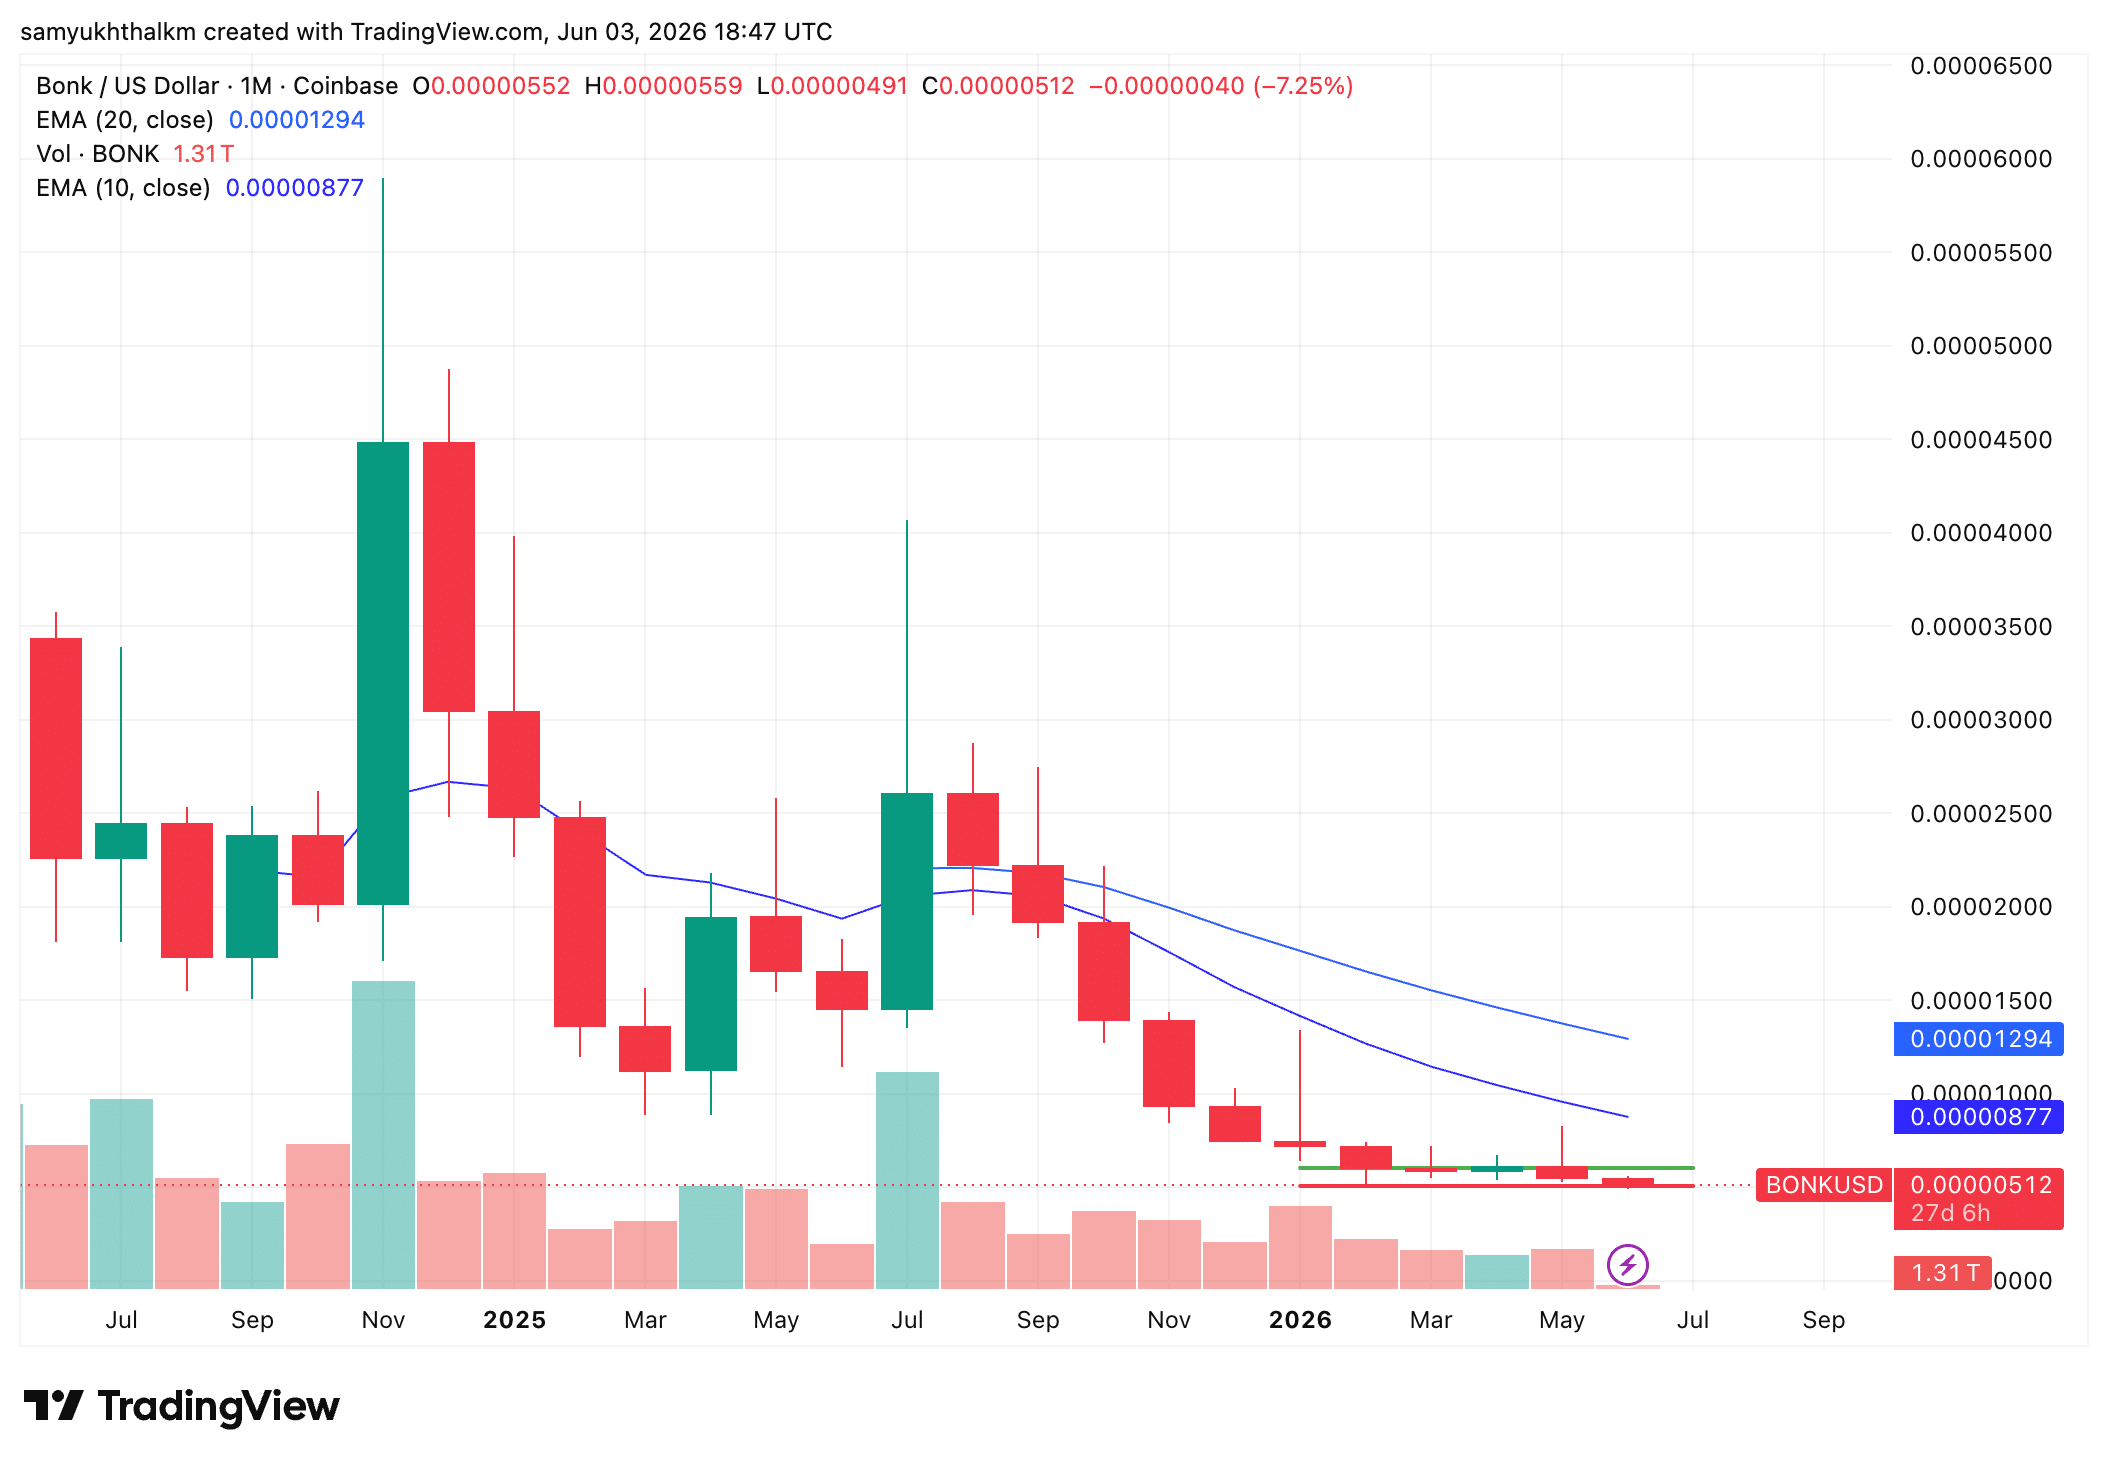
BONK's long-term outlooked seemed to be under pressure too. At the time of writing, the token was trading below both the 10-month EMA at $0.00000877 and the 20-month EMA at $0.00001294. This suggested that the trend had not yet turned bullish. The key long-term support was near $0.00000500. If BONK holds this zone, it could continue building a base before attempting a move up. A stronger long-term reversal would require BONK to reclaim higher levels. Until then, while the market will remain weak, it will definitely be worth looking at for accumulation.
VIEW MORE

Historical Price Performance

Year Highest Price Lowest Price
2026 (to date) $0 $0
2025 $0 $0
2024 $0 $0
2023 $0 $0
2022 $0 $0

BONK has had major boom and bust cycles in the last two years. The altcoin was volatile throughout 2024, with both rallies and equally aggressive pullbacks. Its strongest notable punch-up came in late 2024, when BONK (for just a moment) pushed towards the upper end of its historical range before losing strength. In 2025, the token tried to recover again around mid-year, but that move also failed. Since late 2025, BONK has been falling gradually, with the press time price action becoming much flatter near the $0.000005 zone.

VIEW MORE

Technical Analysis

BONK’s weekly chart looked weak at press time, with the price trading below both key moving averages (MAs). The 20-week EMA was near $0.00000697, and the 50-week EMA was higher at around $0.00001091. Since BONK traded near $0.00000509, both averages were acting as overhead resistance. Simply said, buyers had not regained control of the trend.

Source: BONK/USDT, TradingView

The most important short-term support zone will be around $0.00000490-$0.00000510. A breakdown below this range could open the way towards $0.00000450 and then, $0.00000400. On the upside, BONK first needs to reclaim $0.00000600, followed by the 20-week EMA near $0.00000700 for improved pace.

On the monthly chart, BONK was below the 10-month EMA at $0.00000877 and the 20-month EMA at $0.00001294, keeping the long-term trend under pressure. In June 2026, the altcoin was trading at the lower end of the range. Hence, it seemed like the token was consolidating.

Source: BONK/USDT, TradingView

For a stronger recovery, BONK needs to move back above $0.00000700-$0.00000900. Until then, $0.00000500 will the key level to defend.

Guides

How to Read Bonk Charts and Predict Price Movements?

Most traders use candlestick charts, as they provide more information than a simple line chart. Traders can view candlesticks that represent the price action of Bonk with different granularity – for example, you could choose a 5-minute candlestick chart for extremely short-term price action or choose a weekly candlestick chart to identify long-term trends. 1-hour, 4-hour, and 1-day candlestick charts are among the most popular.

Let’s use a 1-hour candlestick chart as an example of how this type of price chart gives us information about opening and closing prices. The chart is divided into “candles” that give us information about Bonk’s price action in 1-hour chunks. Each candlestick will display the asset’s opening price, closing price, as well as the highest and lowest prices reached within that period.

Bonk Price Prediction Indicators

Moving averages are among the most popular Bonk price prediction tools. As the name suggests, a moving average provides the average closing price over a selected time frame, which is divided into a number of periods of the same length. For example, a 12-day simple moving average is calculated by summing the closing prices over the last 12 days and dividing the result by 12.

In addition to the simple moving average (SMA), traders also use another type of moving average called the exponential moving average (EMA). The EMA gives more weight to recent prices, and therefore reacts more quickly to changes in market conditions.

What Affects the Price of Bonk?

Just like with any other asset, the price action of Bonk is driven by supply and demand. These dynamics can be influenced by fundamental events such as block reward halvings, hard forks, or new protocol updates. Regulations, adoption by companies and governments, cryptocurrency exchange hacks, and other real-world events can also affect market sentiment.

Technical indicators such as moving averages, RSI, and trading volume are also used by traders to anticipate price movements and identify potential trend reversals.

FAQs on Bonk Price Predictions

As of today, Bonk (BONK) is trading at $0.000004. The current market sentiment is Bearish, with RSI at 43.57 (Neutral) and volatility classified as Moderate.
Based on our technical analysis and projected annual growth rate, Bonk could reach $0.000001 by 2027. This estimate assumes continued market momentum and adoption trends.
Long-term forecasts suggest Bonk could appreciate significantly over the next five years, depending on broader market cycles and adoption.
Based on multiple technical indicators, the current outlook for Bonk in 2026 is Bearish. RSI currently sits at 43.57, which indicates Neutral momentum. However, investors should evaluate both technical signals and fundamental developments before making any investment decisions.
Long-term forecasts indicate that Bonk may continue to grow over the next decade if adoption, technology development, and global crypto demand continue to expand.
While Bonk's future value depends on various factors, technical indicators suggest it could experience both bullish and bearish cycles over time. Long-term investors typically monitor RSI levels, moving averages, and broader market sentiment when evaluating BONK's future trajectory.
Disclaimer

AMBCrypto's content is meant to be informational in nature and should not be interpreted as investment advice. Trading, buying or selling cryptocurrencies should be considered a high-risk investment and every reader is advised to do their own research before making any decisions.