Mixed signals for AAVE – Is a $170 breakout likely?

- AAVE has broken above the midline of an ascending channel after a nearly 7% gain.
- Despite a spike in exchange outflows, technical indicators show the trend is yet to flip bullish.
AAVE [AAVE] rebounded over the weekend after China’s new economic stimulus spurred gains across the cryptocurrency market. In the last 24 hours, AAVE gained nearly 7% to trade at $154 at press time.
These gains saw the token recover from a suppressed performance earlier in the week.
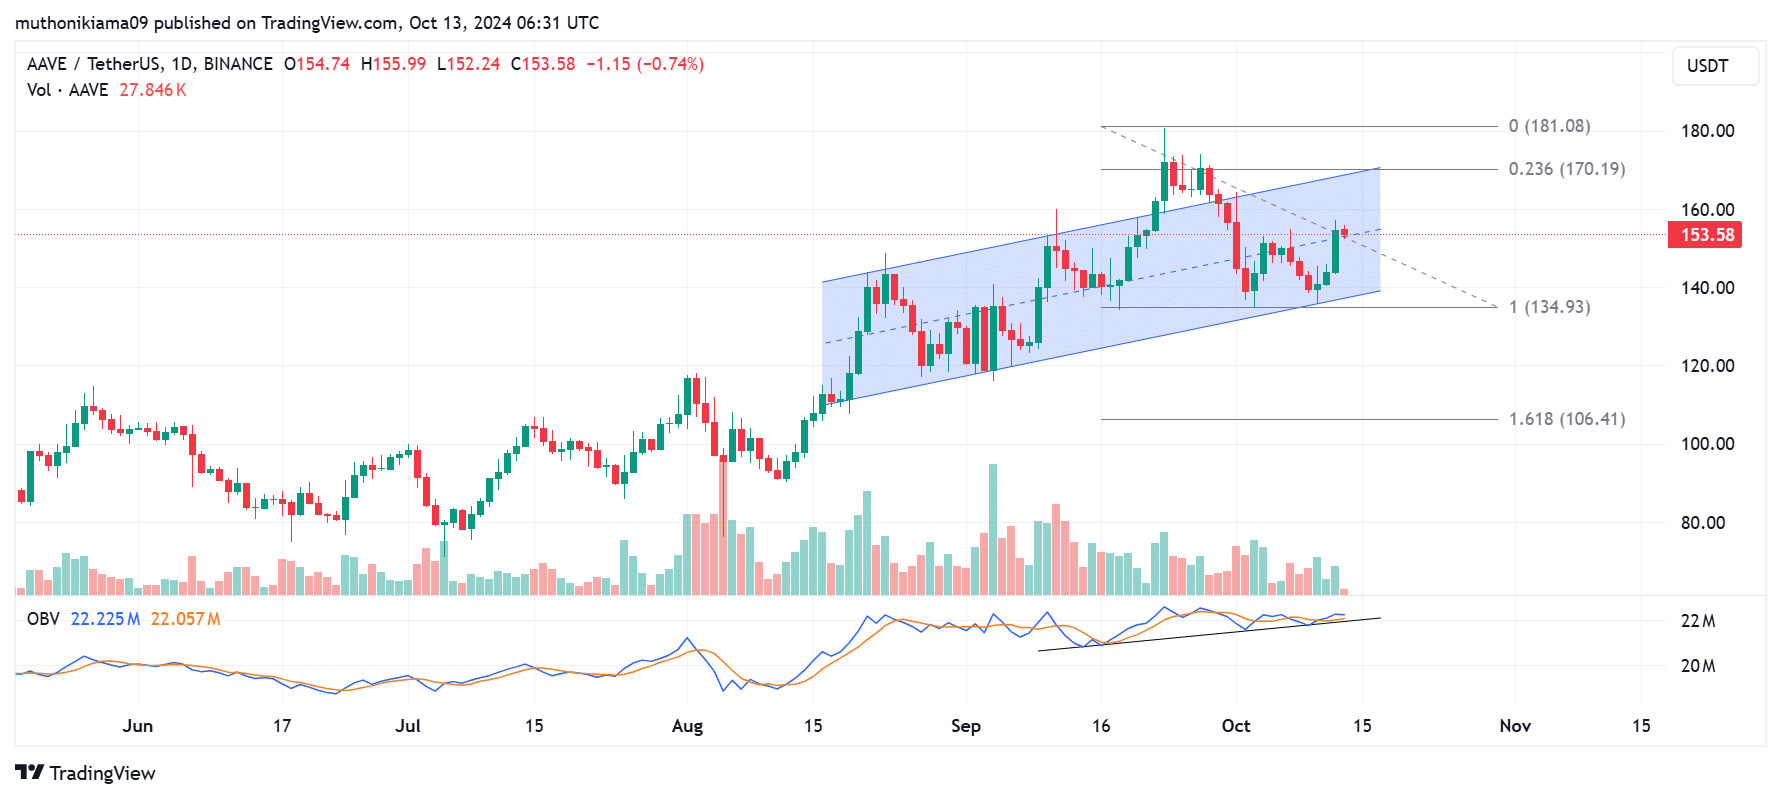
Following this uptrend, AAVE broke out of the midline of its ascending parallel channel on the one-day chart, suggesting that bulls are gaining strength.
For AAVE to break the upper boundary of this channel, it needs buyer support.
The three green consecutive volume histogram bars show that buyers have been in control of the price action. This supported AAVE’s breakout above the midline.
Additionally, the on-balance volume (OBV) indicator has been sloping upwards. This indicator also crossed above the smoothing line, which shows that the crowd is turning bullish.
For AAVE to break out above the ascending channel and confirm the bullish thesis, it needs to overcome resistance at the 0.236 Fibonacci level ($170).
Conversely, this pattern will be invalidated if the price drops below support at $134.
AAVE exchange outflow data is bullish
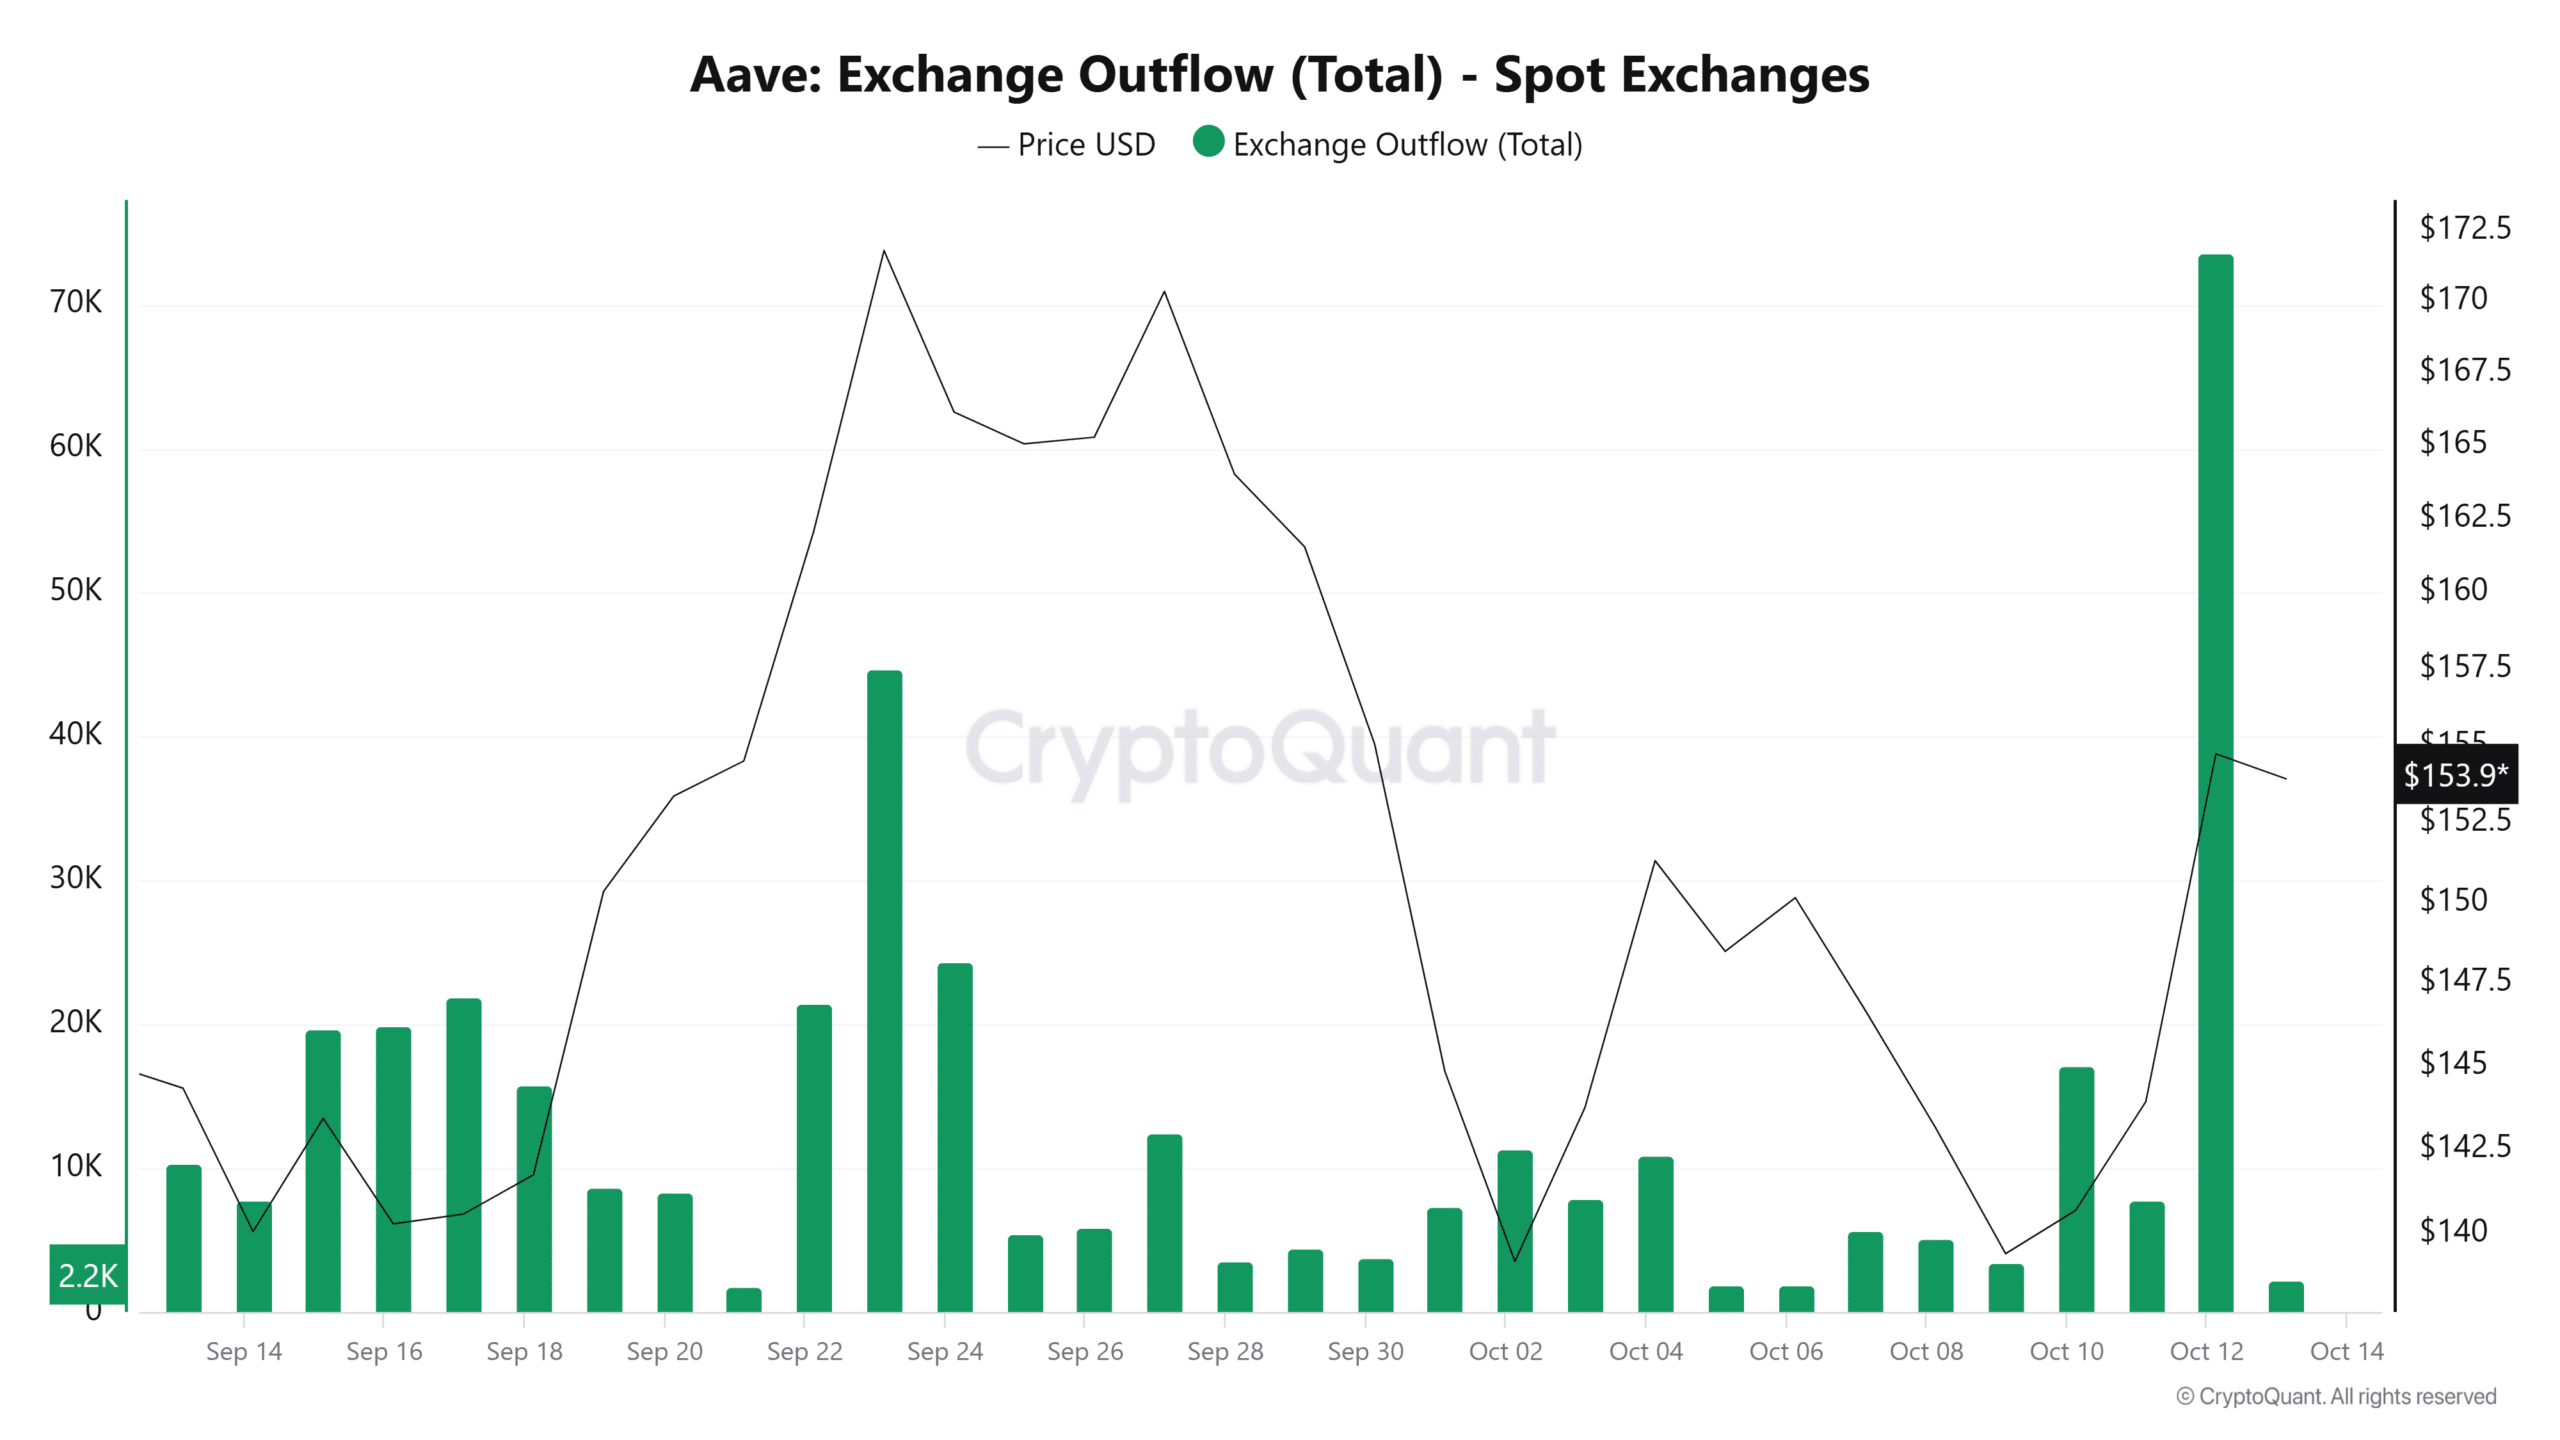
Buyers could continue overwhelming sellers as exchange inflow data shows traders are withdrawing their AAVE from exchanges at a high rate.
On the 12th of October, exchange outflows reached a one-month high, showing an unwillingness to sell.
If more traders are withdrawing their tokens from exchanges, it relieves the short-term selling pressure, paving the way for a strong bullish trend.
These technical indicators are bearish
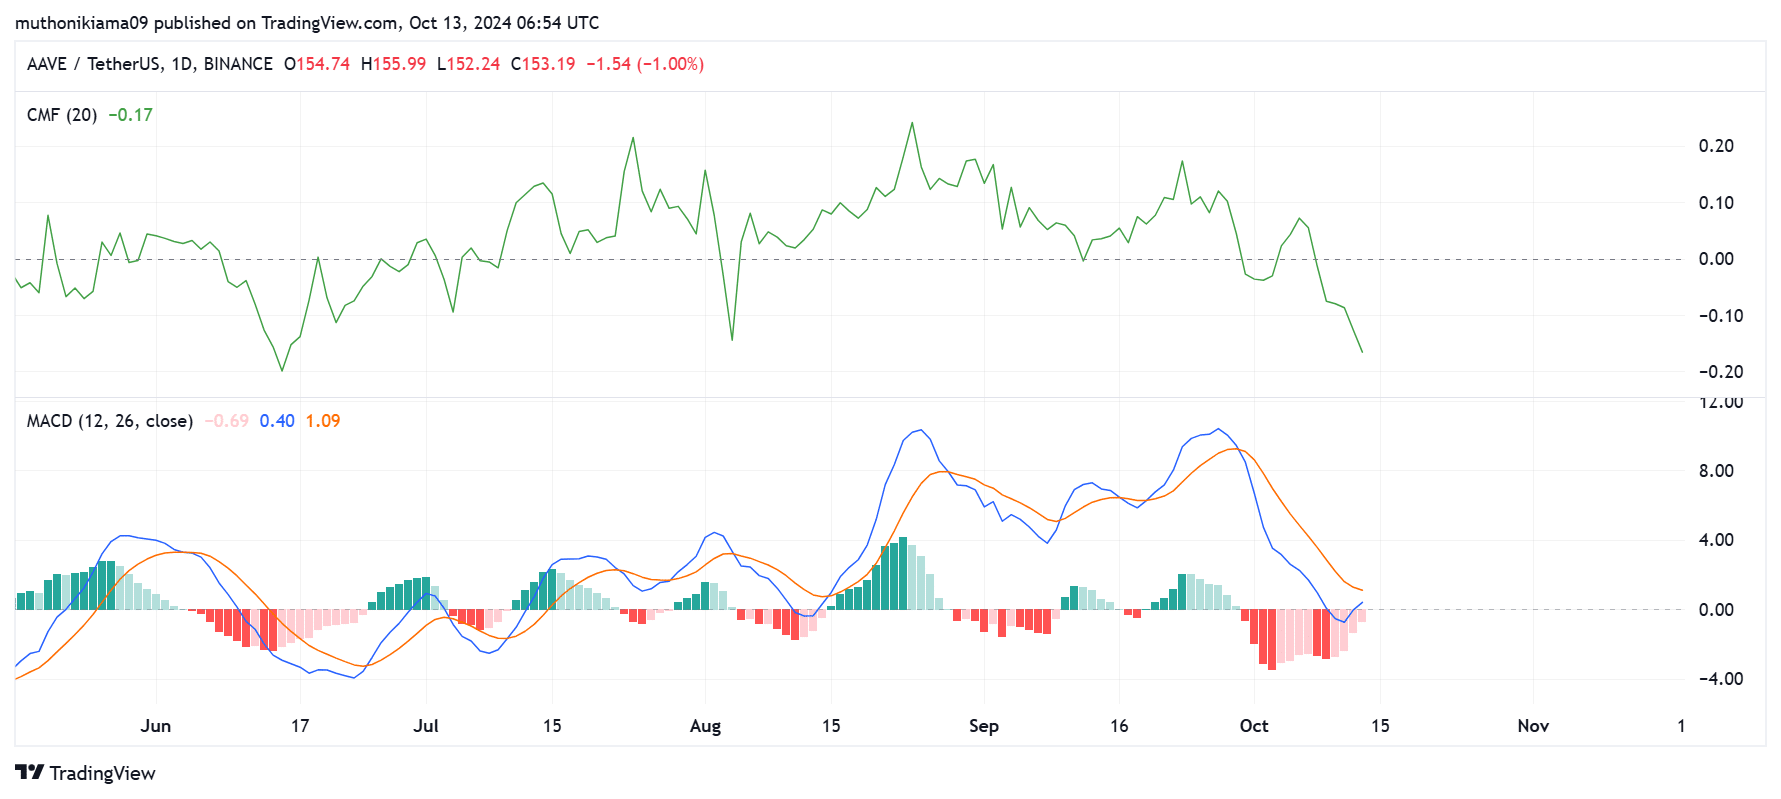
A look at the Chaikin Money Flow (CMF) shows that capital is still flowing out of AAVE. At press time, the CMF had a score of -0.17.
This indicator has also been forming lower lows despite the price gain, indicating that the current trend is weak.
The Moving Average Convergence Divergence (MACD) is sitting below the signal line, which also shows a bearish bias.
However, the MACD line is tipping north, and if it crosses above the signal line, it will confirm that the altcoin has entered an uptrend.
A look at the Long/Short Ratio
The long/short ratio on Coinglass shows that derivative traders are bearish.
In the last 24 hours, this ratio has dropped from a neutral level of 1 to 0.87, suggesting that market participants are not convinced about a sustained uptrend.
Read Aave’s [AAVE] Price Prediction 2024–2025
On Binance, the accounts taking long positions have dropped drastically, from 60% to 47%. At the same time, short accounts on AAVE have increased from 39% to 52%.
The changes in this ratio show that after AAVE started gaining, traders increased their short positions, showing conviction that the uptrend could fail.


