Will Helium’s breakout lead to a rally? What HNT’s charts reveal
HNT’s bullish momentum continues to build, as it edges closer to a critical breakout zone.

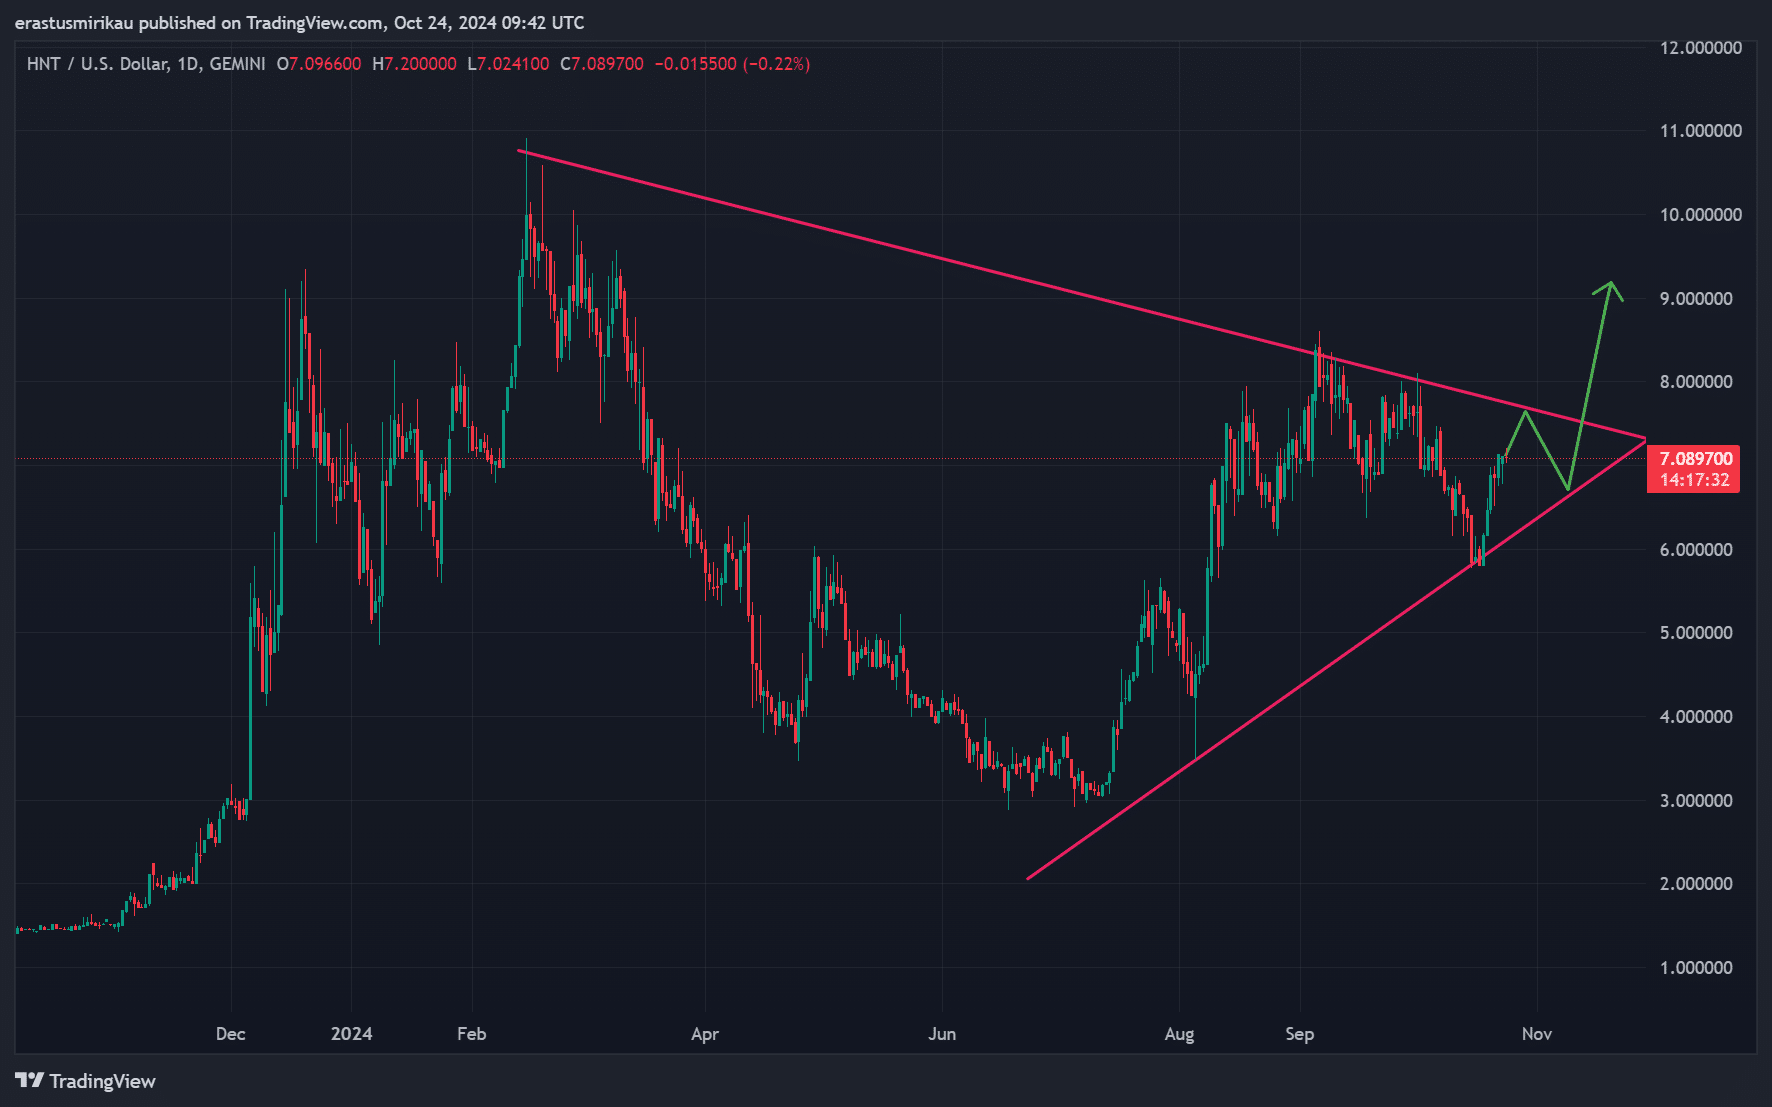
- HNT was nearing a breakout from a symmetrical triangle, with a potential target above $9.00.
- Whale accumulation and rising long positions indicated growing confidence in a sustained rally.
Helium [HNT] was gaining attention as it approached a critical breakout zone, with potential for a price surge if resistance levels are broken.
Trading at $7.08 at press time, HNT has surged by 17% over the past week.
This upward movement has brought the token close to a key resistance level, but the bigger question remains — can HNT sustain this momentum and trigger a larger bullish rally?
HNT forms a symmetrical triangle
Helium’s chart revealed a symmetrical triangle pattern, which has been in place since early 2024. This pattern is known for indicating that a significant price move may be on the horizon.
As the price consolidates near the triangle’s upper trendline, HNT had started nearing a pivotal moment.
If the token breaks through the resistance at $8.00, it could open the door for further gains, potentially pushing HNT towards the $9.00 mark. Therefore, this breakout could be critical for traders watching closely.
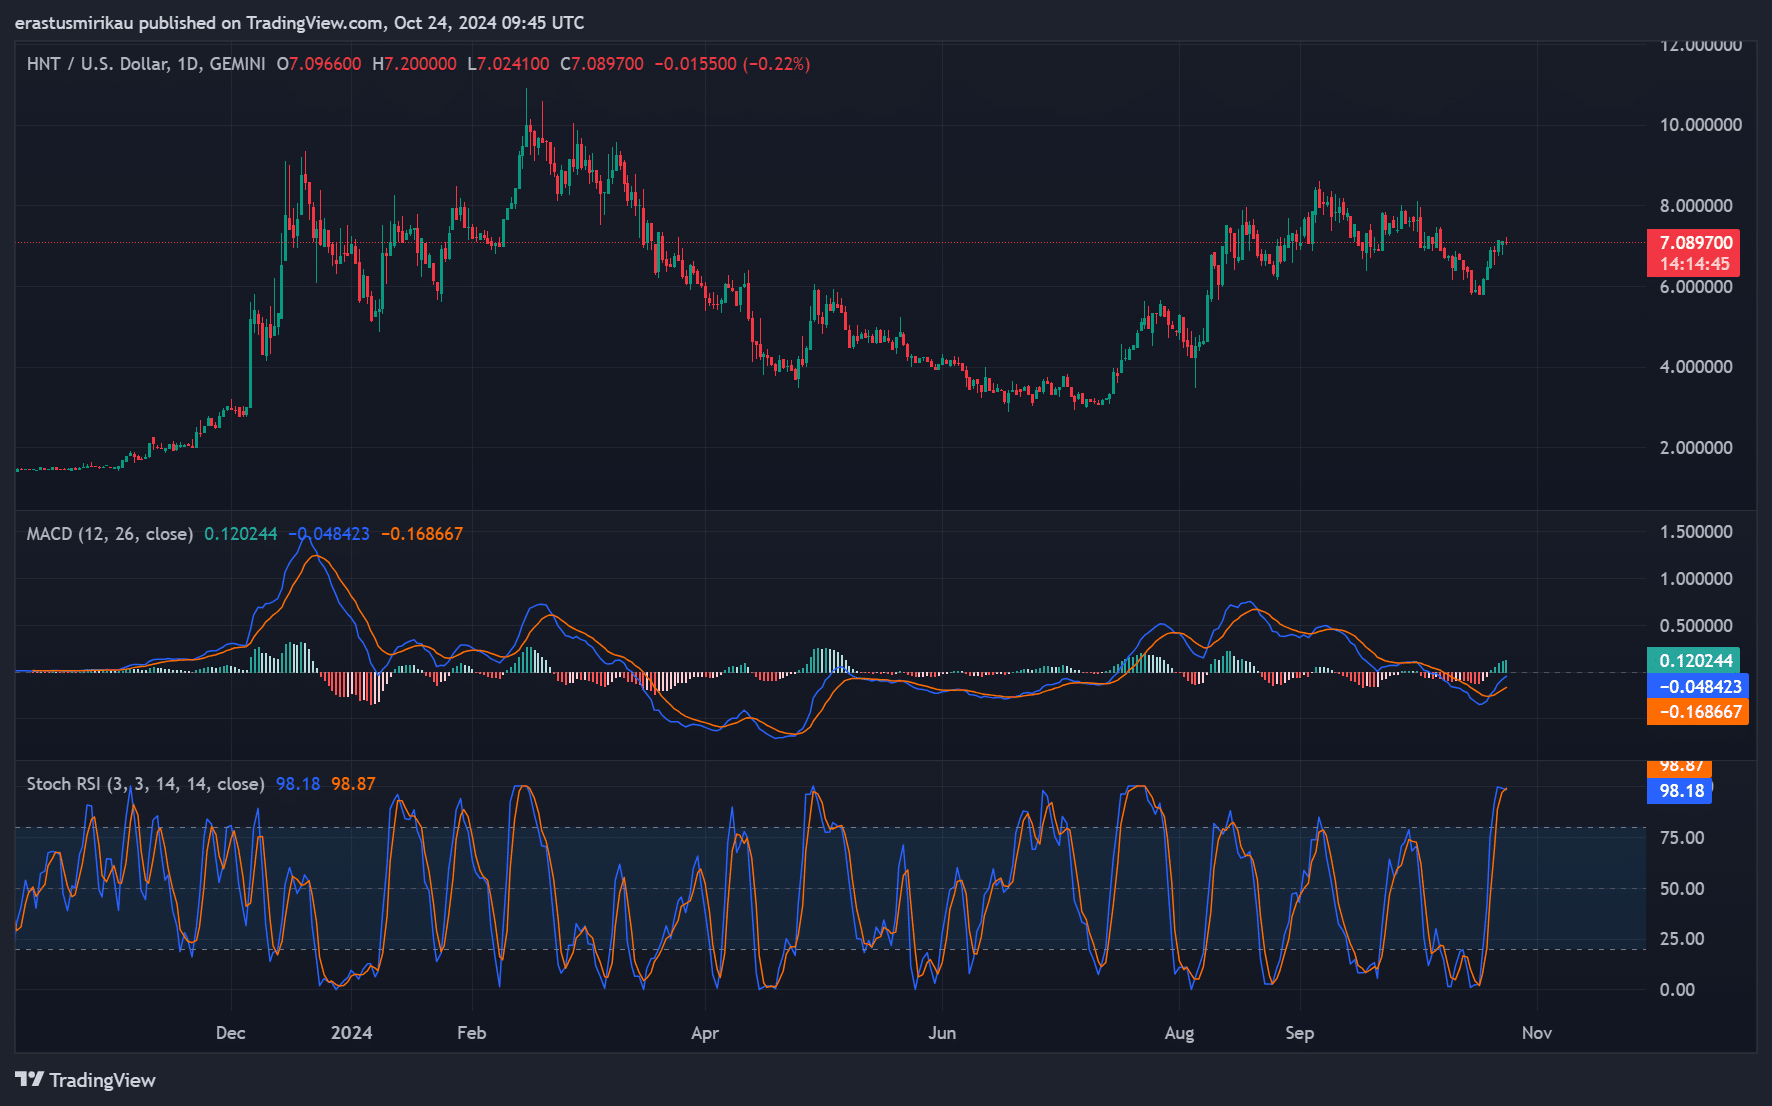
What do major indicators suggest?
When examining technical indicators, the MACD provides positive signals. The MACD line has crossed above the signal line, indicating upward momentum.
Additionally, the histogram has flipped green, further supporting the bullish outlook. This momentum could attract additional buyers into the market.
However, the Stochastic RSI tells a slightly different story. In the overbought zone at 98 at press time, it suggests that HNT may face a brief pullback before continuing its upward trend.
Despite this, if the pullback remains minor, the market could see another surge, further boosting the bullish narrative.
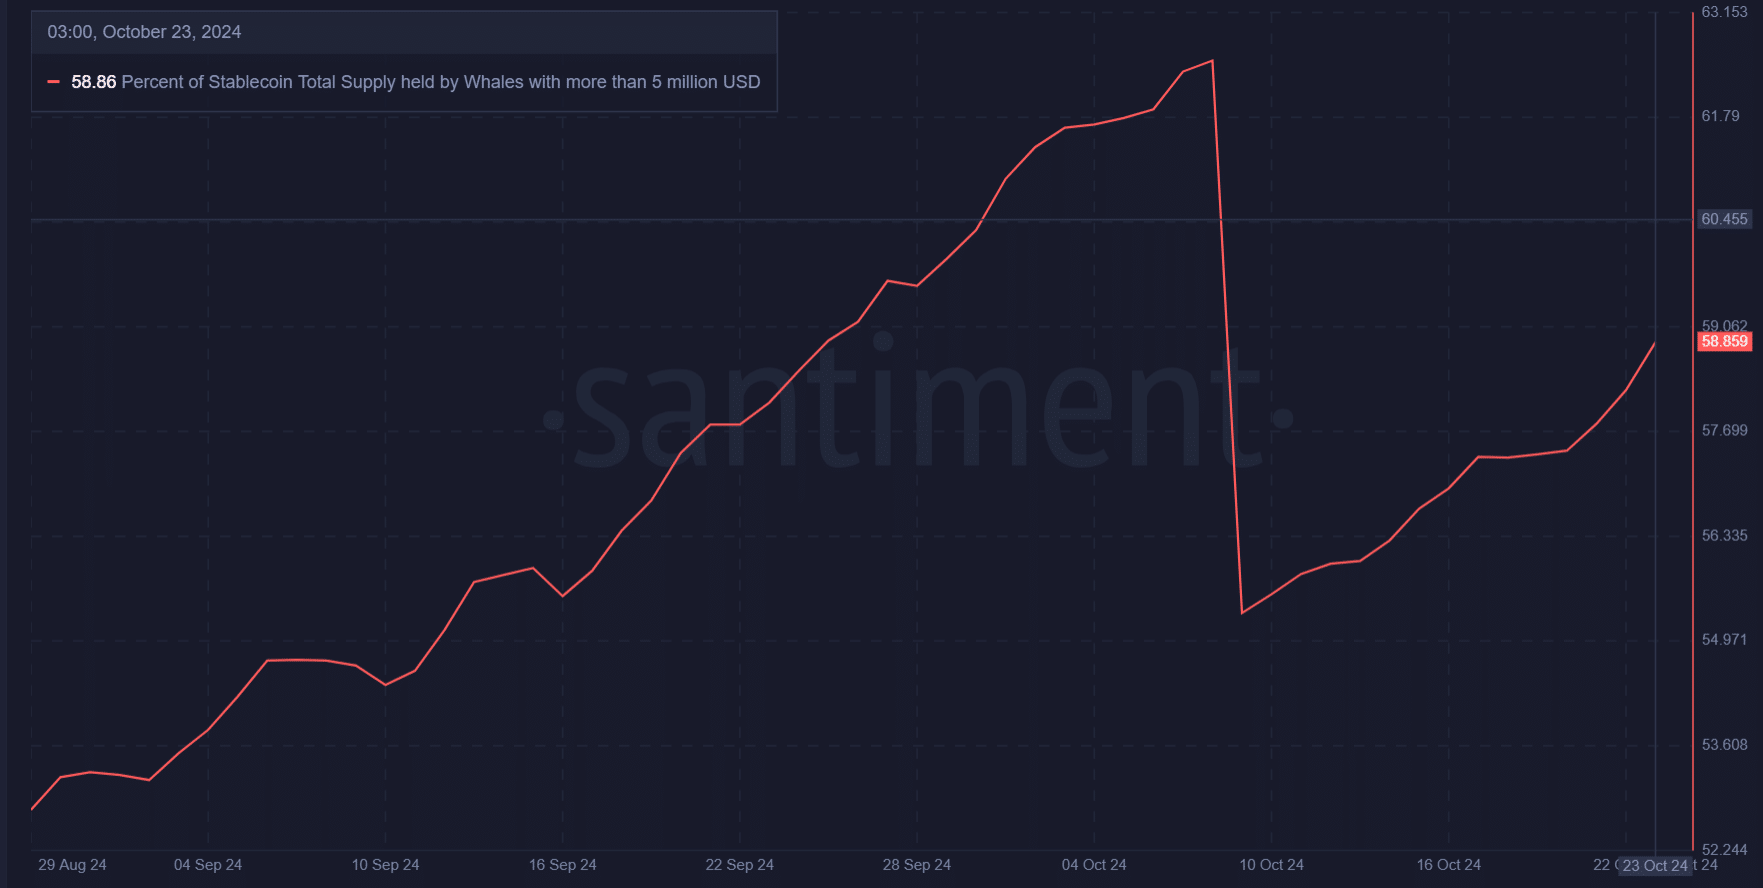
Whale accumulation: A sign of confidence?
Large investors are showing interest in HNT, as evidenced by the fact that whales with holdings of more than $5 million USD control 58.86% of the stablecoin supply.
This accumulation suggests confidence among major players. If the trend continues, it could provide a strong foundation for HNT’s future price movements.
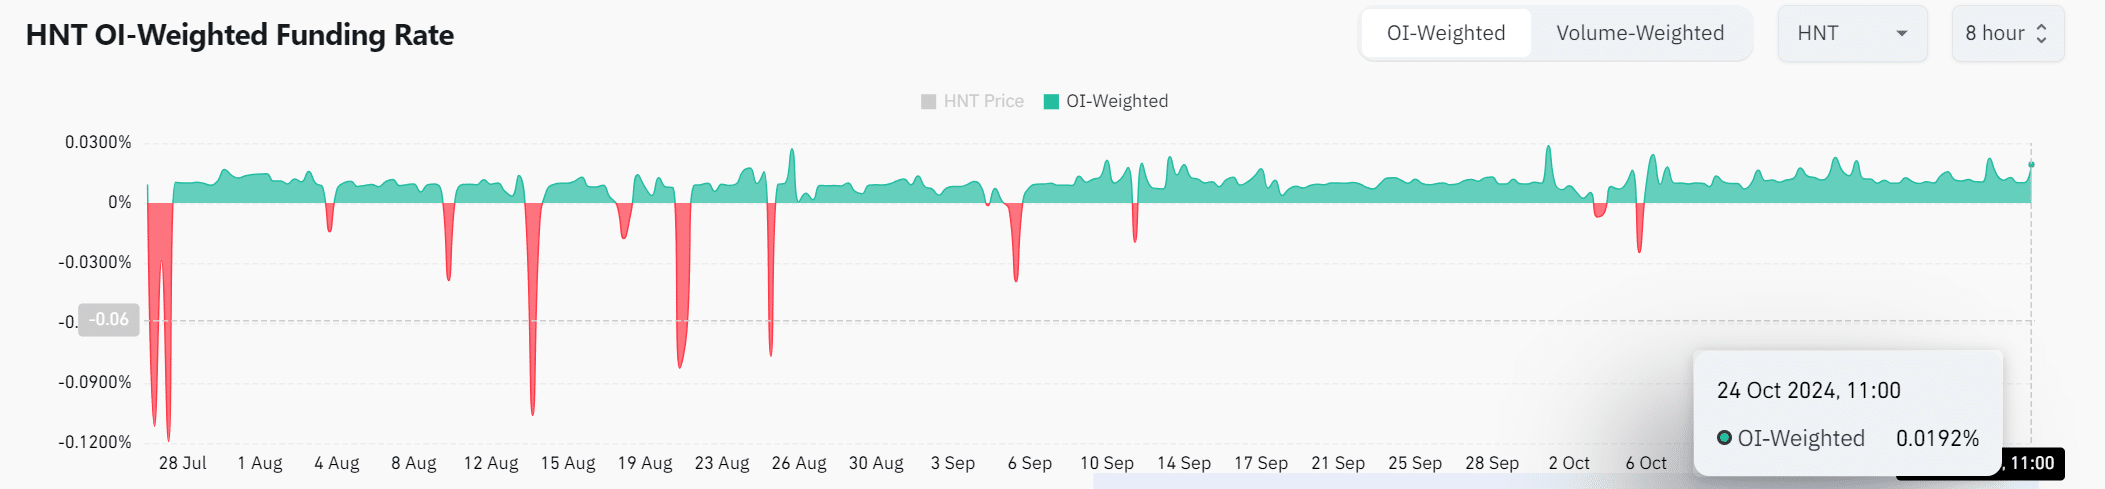
OI-Weighted Funding Rate: What does it reveal?
The Open Interest (OI)-Weighted Funding Rate for HNT revealed increasing bullish sentiment among Futures traders. At press time, the OI-Weighted Funding Rate sat at 0.0192%.
This positive Funding Rate indicated that more traders were betting on price increases, as they are willing to pay to maintain their long positions.
Is your portfolio green? Check out the HNT Profit Calculator
Can HNT sustain its breakout?
Traders should remain cautious as the overbought Stoch RSI suggests a short-term pullback could occur.
If HNT can break above the $8.00 resistance and hold, it is well-positioned to trigger a larger rally toward $9.00 or beyond.