Stellar – Why XLM buyers should wait before opening a long position
Stellar is nearing a key resistance - Will bulls push through, or is a pullback looming?

- XLM’s recent price action has positioned it near crucial resistance levels, with the 20-day, 50-day, and 200-day EMAs
- Failure to hold above the key support levels can expose XLM to further downside risks
Stellar [XLM] has recently rebounded from its long-term support near the $0.08 mark. Despite facing challenges in reclaiming its bullish momentum, the altcoin’s recent price action has brought it closer to key resistance levels.
Let’s analyze if the bulls have enough strength to continue this trajectory.
XLM price analysis
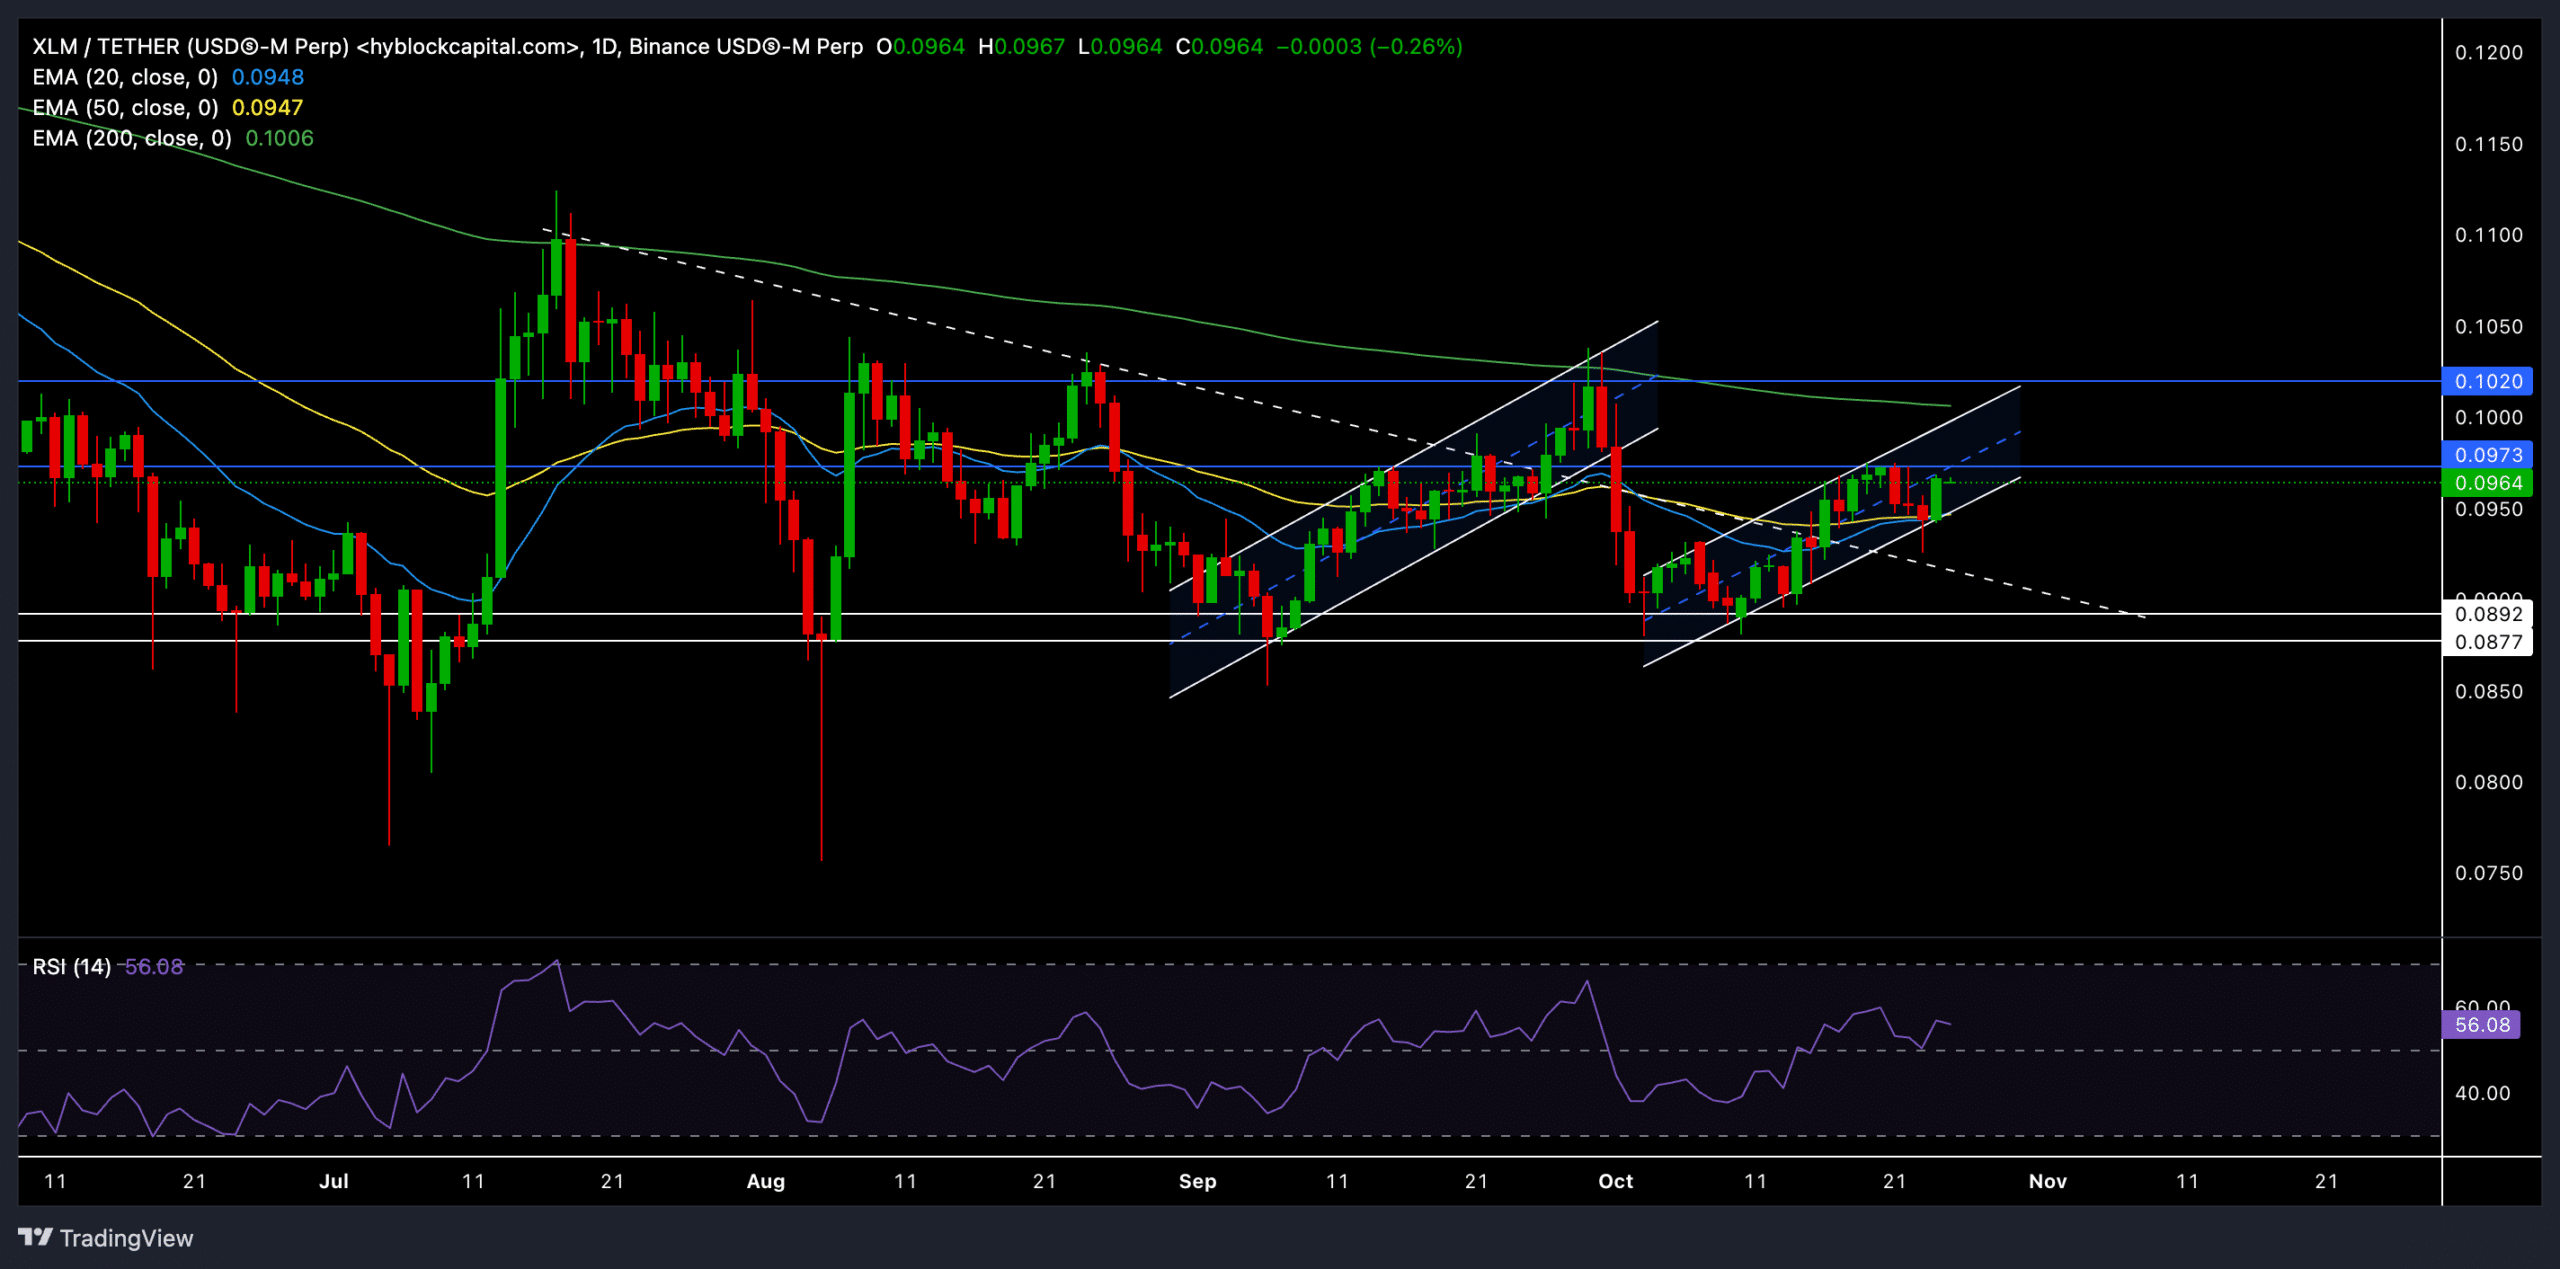
After finding a reliable rebound from the $0.08 support, XLM surged to test its immediate resistance levels. However, the altcoin has struggled to break above its 200-day EMA, currently positioned at $0.1007, which has capped the gains in the recent uptrend.
At the time of writing, XLM was trading at $0.0954, hovering around its 20-day EMA ($0.0945) and 50-day EMA ($0.0946). The confluence of these EMAs has provided near-term support at the lower boundary of an ascending channel, potentially forming a base for further recovery.
The Relative Strength Index (RSI) was at 53.55, suggesting a somewhat neutral stance in the XLM market. A move above the 60-mark could confirm bullish momentum in the near term. Should Bitcoin witness a huge influx of buyers and XLM bulls close above the 200-day EMA amid a bull run, it could pave the way for a rally towards the $0.11 resistance.
Key levels to watch
Support – The $0.094 level is immediate support near the confluence of the 20-day and 50-day EMAs. Any decline below this level could expose XLM to further losses, with the next support region at $0.087-$0.089.
Resistance – The 200-day EMA ($0.1007) remains a critical level to watch. A break above this could lead to a test of the $0.102 resistance, followed by a move towards $0.109.
Derivatives data for XLM revealed THIS

XLM’s Open Interest rose by 2.89% to $30 million, suggesting that traders are still actively engaged. Similarly, trading volume climbed by around 4% to $55 million. The long/short ratio on Binance for XLM/USDT was 1.858, indicating that many traders are currently opting for long positions.
OKX’s ratio stood at 1.68, reaffirming the near-term bullish sentiment.
XLM seemed to be at an important juncture at press time, with the ascending channel challenging its bullish trajectory. If XLM fails to break above its prevailing pattern, the coin might continue its sideways movement with some downside risks if it falls below the $0.094 support.
Traders should monitor Bitcoin’s broader market trend, especially as it will likely influence XLM’s price action.