
- Analysis reveals that TIA has formed an inverse head-and-shoulders pattern, a signal that an asset is gearing up for gains.
- However, the anticipated rally has been delayed, with technical indicators hinting at a potential minor pullback.
Over the past month, Celestia [TIA] has seen bearish momentum, with its price falling by 6.54% to $5.93. Yet, despite this downward pressure, bullish signs are emerging, suggesting a possible trend reversal on the horizon.
Still, TIA dipped by an additional 3.15% at press time in the last 24 hours, and may face further declines before a solid rally takes shape.
Bullish inverse head-and-shoulders pattern sets TIA for potential upside
An inverse head-and-shoulders pattern—a bullish indicator that often precedes a significant rally—has surfaced for TIA. This formation typically signals a move upward, with the target based on the distance between the neckline and the pattern’s peak.
For TIA, this could translate to a projected 51.36% gain, bringing its price to a target of $9.861. Continued momentum might then propel TIA further, with a secondary target of $11.880.
Currently, TIA’s price is declining and may find support at $5.589, a level that could prompt a rebound and continuation to the upside. However, if TIA falls below $4.506, it would invalidate the bullish inverse head-and-shoulders pattern.
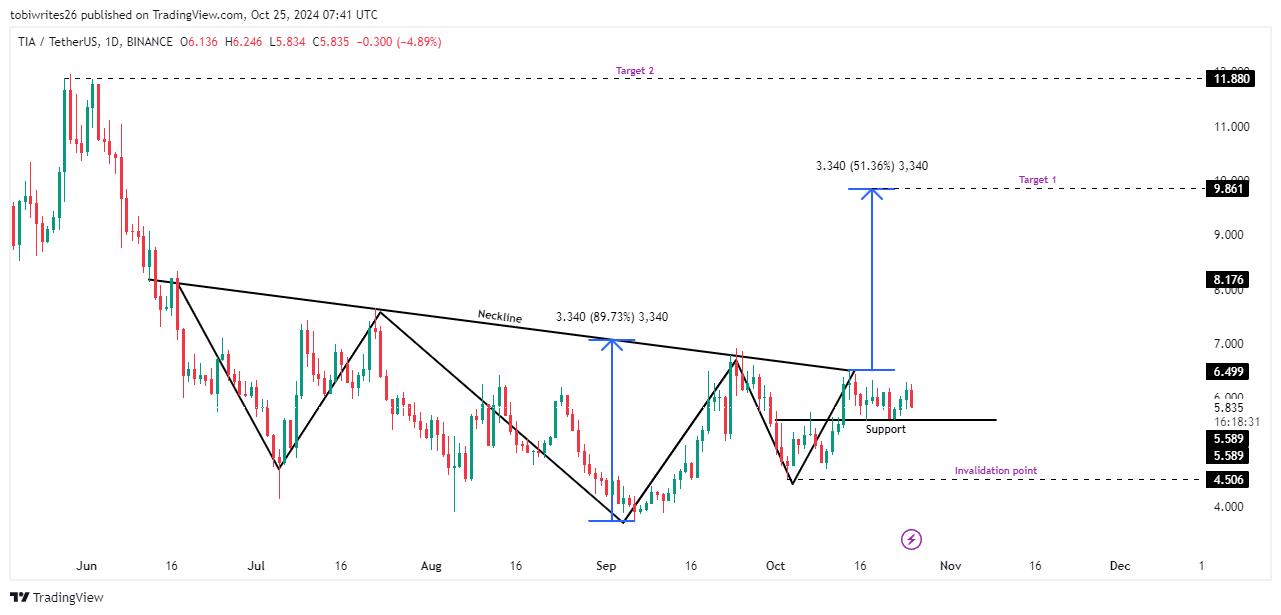
Source: Trading View
Celestia sees corrective move causing a downtick
TIA’s rally has been delayed, as it has yet to rise above the neckline—an important level to indicate a potential rally.
AMBCrypto’s analysis, using key technical indicators, suggests that while a minor downturn may persist, TIA’s overall structure remains bullish, with both indicators staying in positive territory.
One of the primary indicators in this analysis is the Chaikin Money Flow (CMF), which gauges buying and selling pressure by combining price and volume to determine whether an asset is being accumulated (buying pressure) or distributed (selling pressure).
With the CMF currently positive, there is underlying buying strength, suggesting that any current downtick is likely a minor correction.
Similarly, the Relative Strength Index (RSI)—which measures the speed and magnitude of price movements—echoes the CMF’s outlook. Despite the recent downtick, the RSI remains in the positive zone, supporting a bullish outlook.
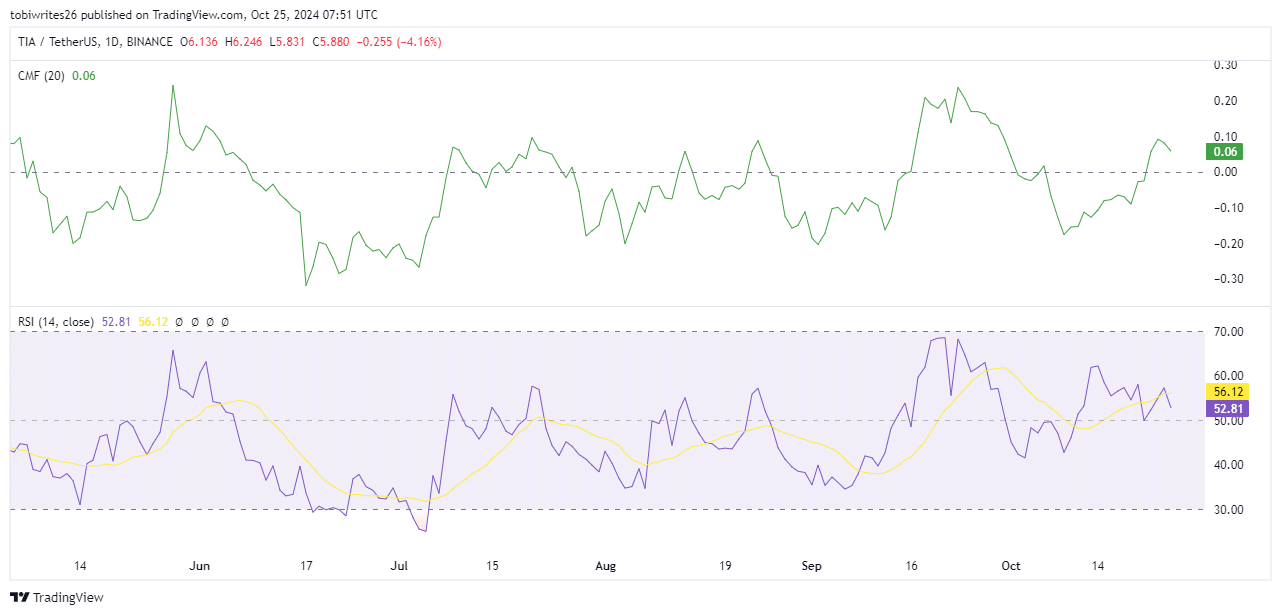
Source: Trading View
A reversal in these indicators to the upside could influence TIA’s price moving higher, with the potential for further gains.
Broad market outlook
AMBCrypto’s analysis on a higher timeframe reveals that market sentiment for TIA remains bullish, with participants showing increased interest in holding rather than selling.
Is your portfolio green? Check out the TIA Profit Calculator
Data from Coinglass’s Exchange Netflow indicates a high negative flow, which means that more TIA tokens are being withdrawn from exchanges than deposited. This trend implies that investors are more inclined to hold their TIA, rather than sell them.
If this pattern continues, it could push TIA’s price higher from its current level, fueled by sustained holding interest among market participants.