Sui flips Solana, Ethereum on THIS front – What about SUI’s price?
What's next for SUI price as it outperforms Solana and Ethereum on net flows.

- Sui eclipsed Solana and Ethereum on net inflows.
- But SUI’s pullback could extend lower to $1.7 if the weakening persisted.
Sui [Sui] has been among the top emerging blockchains in 2024, ready to slash part of Ethereum [ETH] and Solana’s [SOL] market share.
Recently, the chain surpassed ETH and SOL on net inflows, as noted by Mysten Labs co-founder Adeniyi Abiodun, who also leads the team behind the Sui chain.
He said,
“Sui recorded higher net inflows than Solana and Ethereum combined with $24.3M”
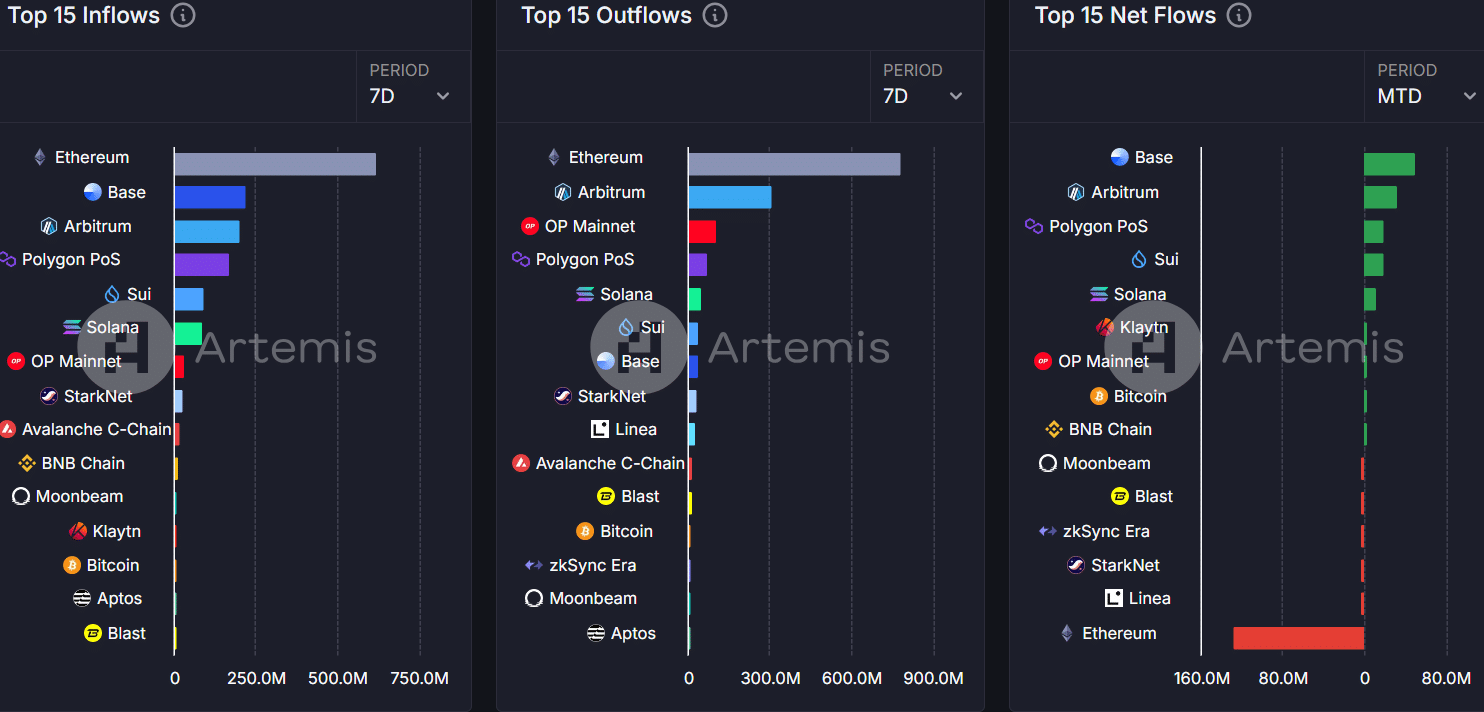
Artemis data showed Sui had a significant lead over the past 7 seven trading days on inflows, outflows and netflows.
It saw more inflows than Solana on the weekly charts. On a month-to-date (MTD) basis, it had $19.3 million in net inflows compared to Solana’s $12.3 million as of the time of writing.
SUI vs SOL
Sui has been deemed a great alternative to SOL, and some analysts even believe that SUI’s price action could follow SOL’s trajectory.
In fact, SUI outperformed SOL on the price charts in August and September, as shown by the wild 300% run-up in SUI/SOL ratio.
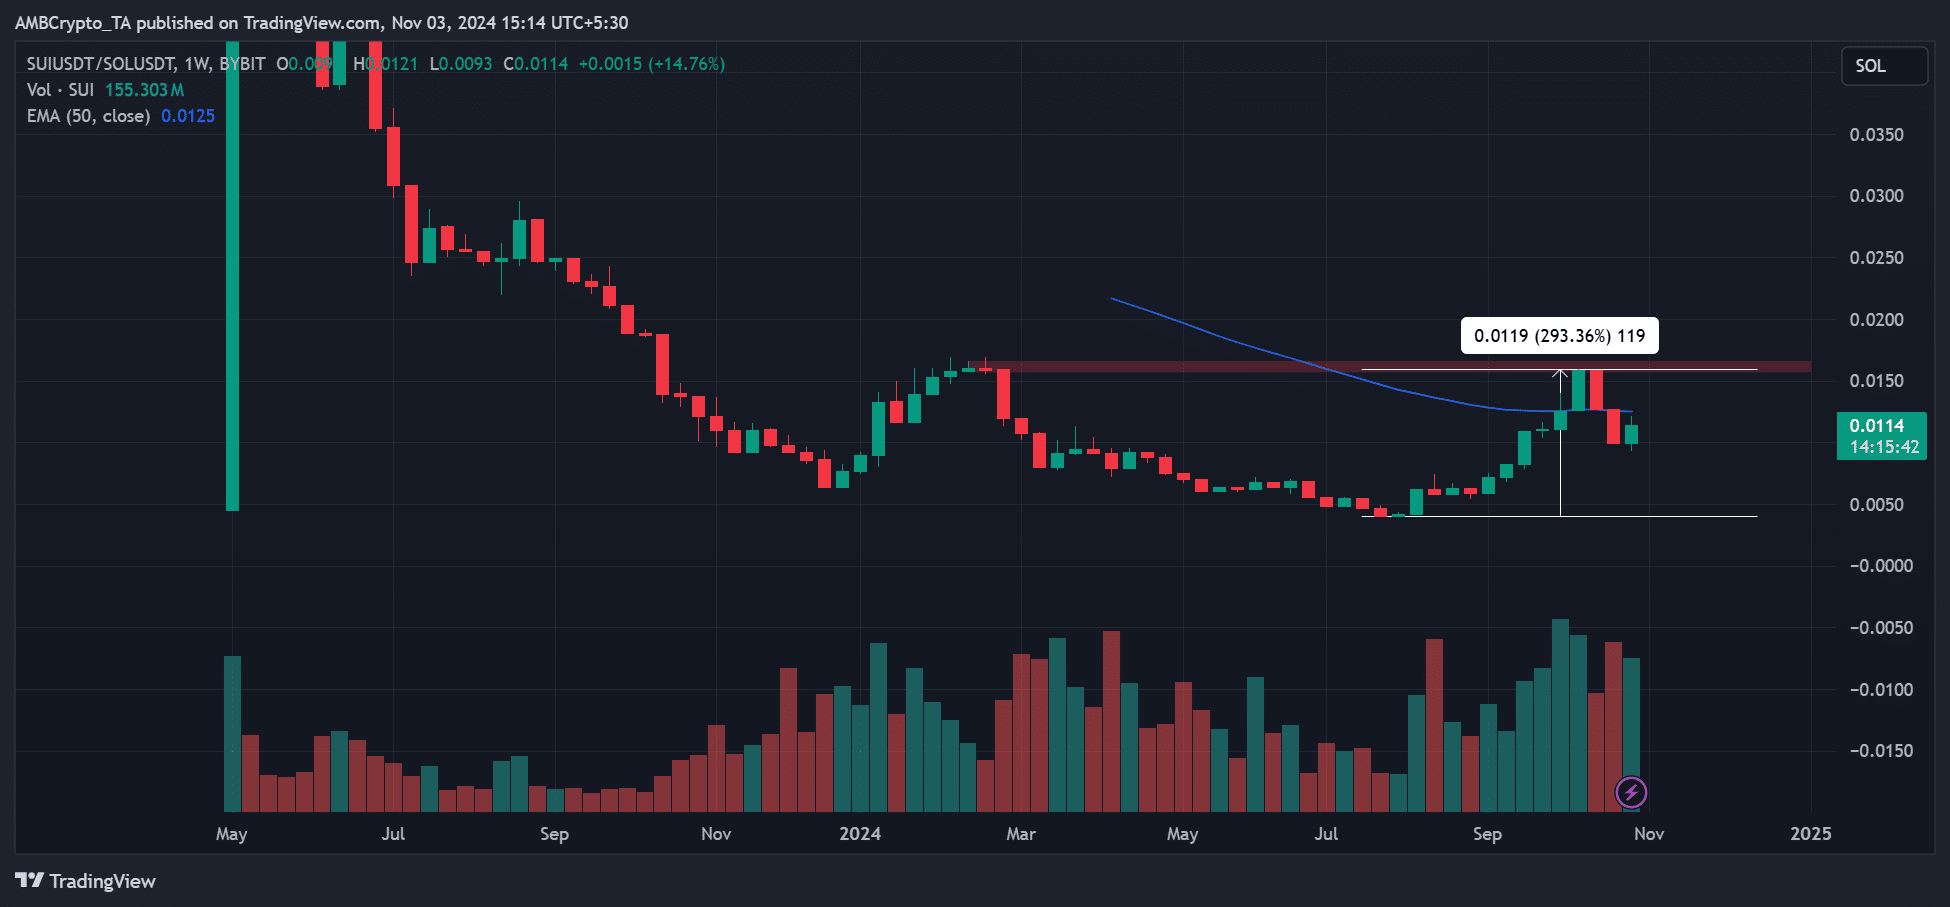
The SUI/SOL ratio tracks SUI’s relative performance to SOL. However, in October, the ratio declined, suggesting that SUI underperformed SOL.
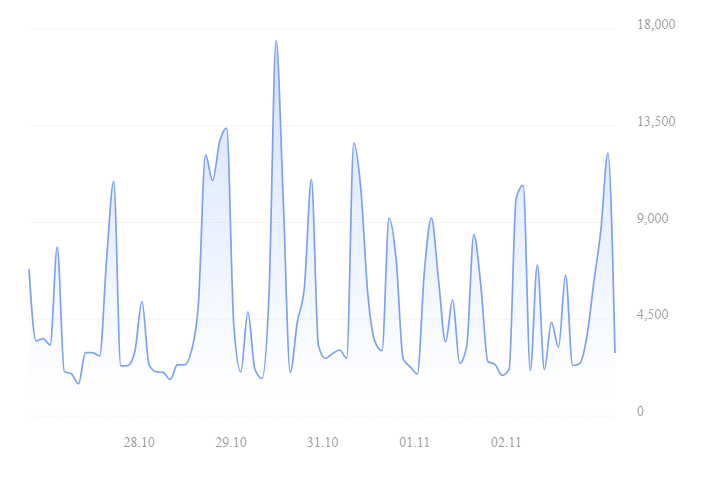
However, the chain still saw modest network growth, which could signal increased interest and boost SUI prices. Its new accounts surged 5% in the past 7 days and reached 862.7K, which marked increased market interest in the altcoin.
Despite the surge in interest, SUI’s market positioning was almost neutral, mirroring the broader market sentiment ahead of the US elections.
Read Sui [SUI] Price Prediction 2024-2025
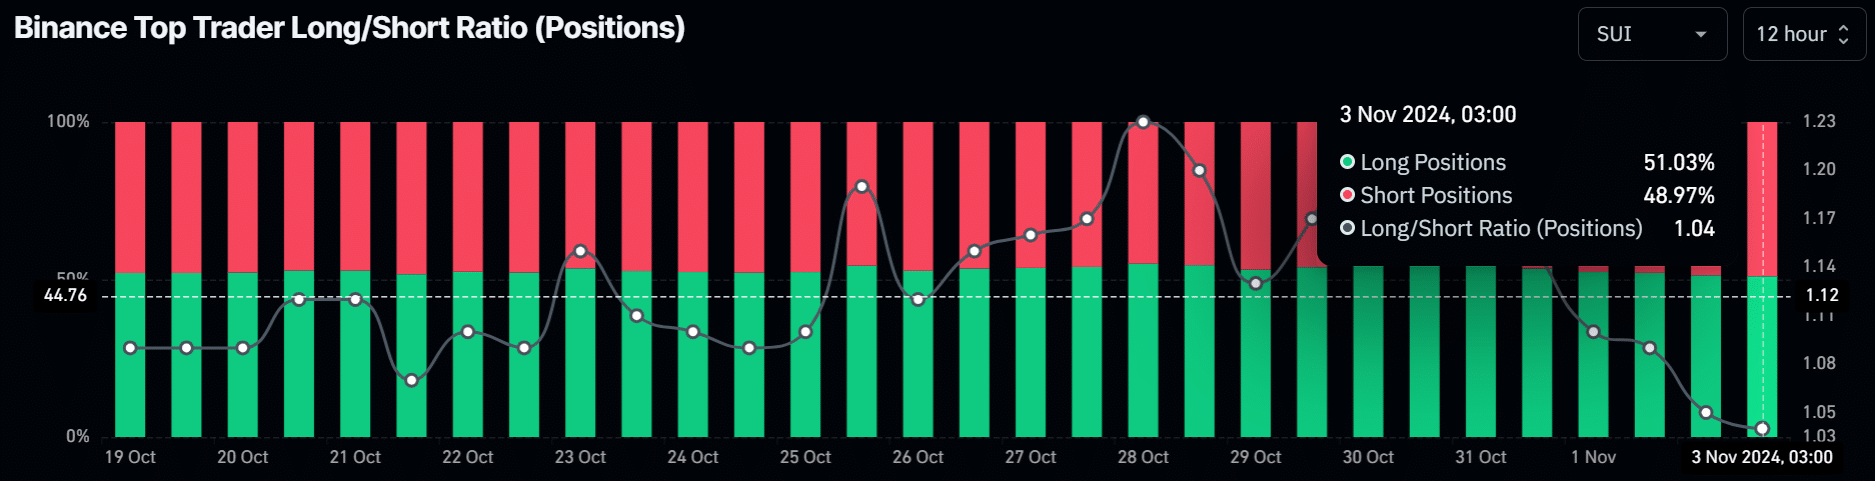
Top traders on Binance had a slight dominance in long positions, at 51%, compared to nearly 49% shorts. The negligible difference meant that the market could go either direction in the short term, depending on the election outcome.
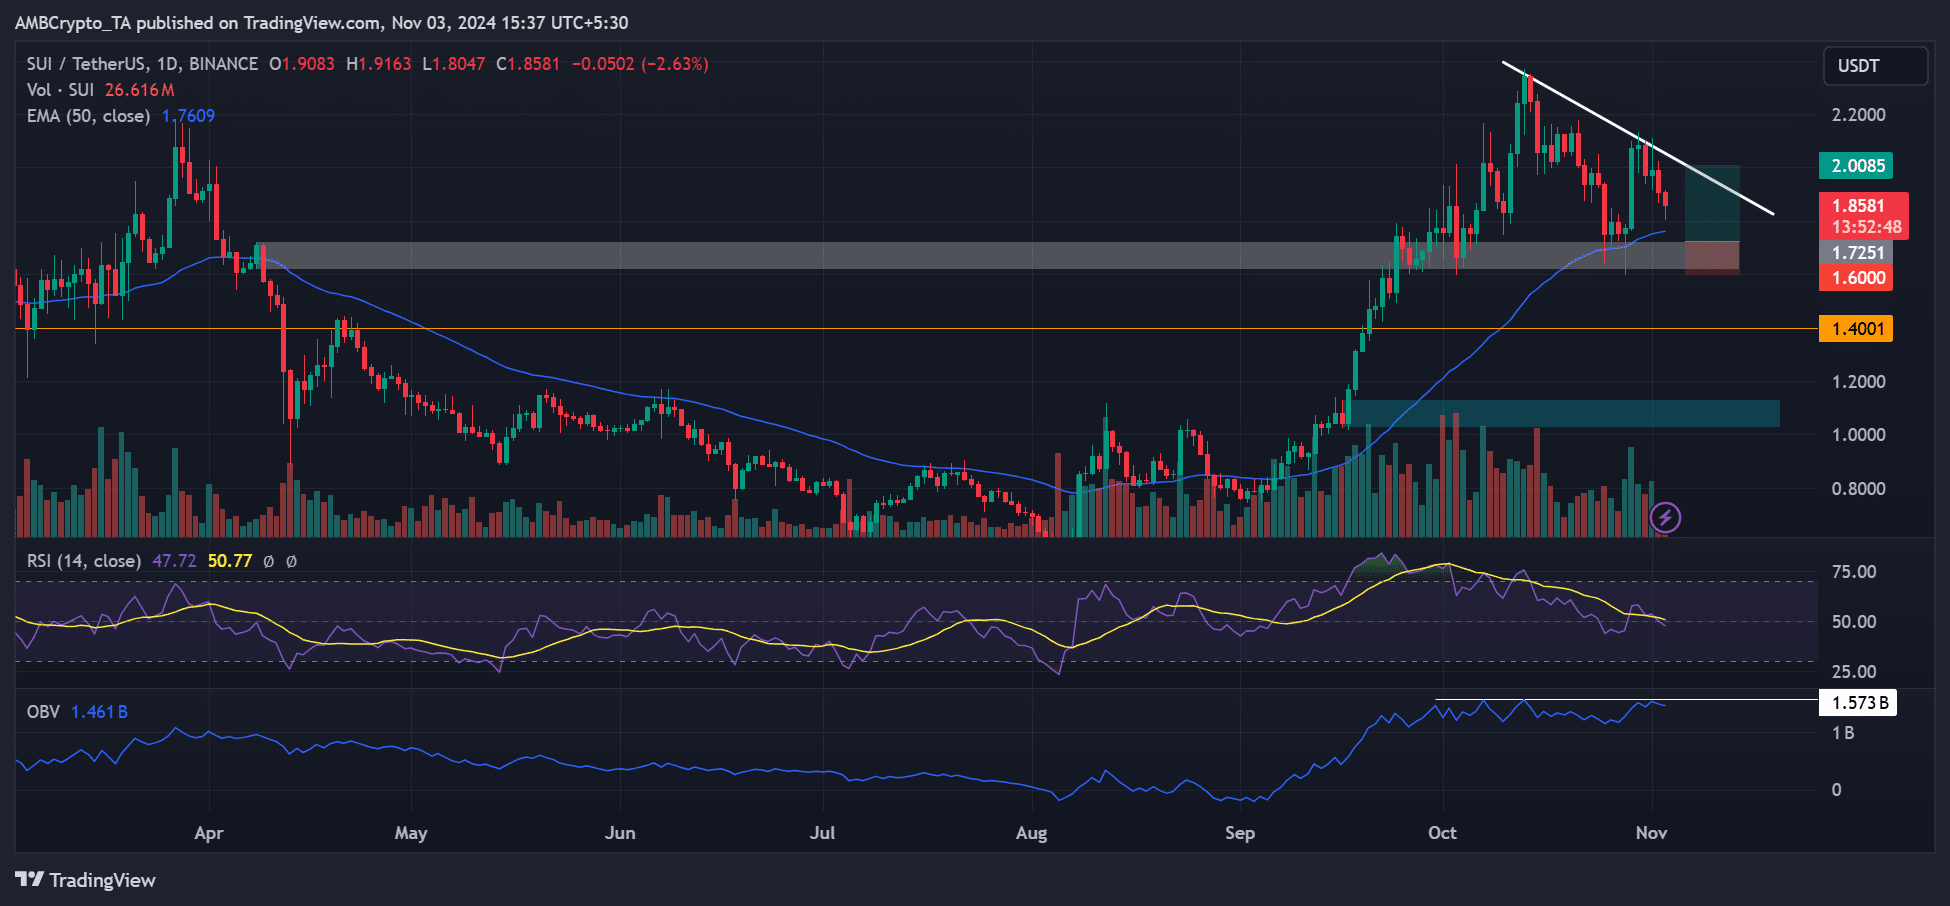
However, the price chart showed a strong support above $1.6, which triggered a price rebound in September and October.
If the pattern repeats, SUI could recover from it and eye the trendline resistance near $2. That would be a 16% potential recovery from the $1.6 – $1.7 support zone.