After a 25% price drop, can Kaspa [KAS] crypto rebound to $0.12?
![After a 25% price drop, can Kaspa [KAS] rebound to $0.12?](https://ambcrypto.com/wp-content/uploads/2024/11/Will-KASs-breakdown-end-1200x686.webp)
- Kaspa’s price dropped by double digits over the last 30 days
- Several metrics hinted at a trend reversal towards $0.12
The last 30 days were disastrous for Kaspa [KAS] as it shed a substantial share of its value. This might have sparked some panic among investors.
However, a few of the on-chain metrics and technical indicators hinted at a trend reversal. Therefore, AMBCrypto investigated further to find out the viability of bulls taking over.
Kaspa’s latest bloodbath
KAS investors were having a hard time as the token’s price dropped by more than 25% in the last 30 days. In fact, in the last seven days alone, the token’s value plummeted by over 8%. At the time of writing, Kaspa was trading at $0.11 with a market capitalization of over $2.7 billion.
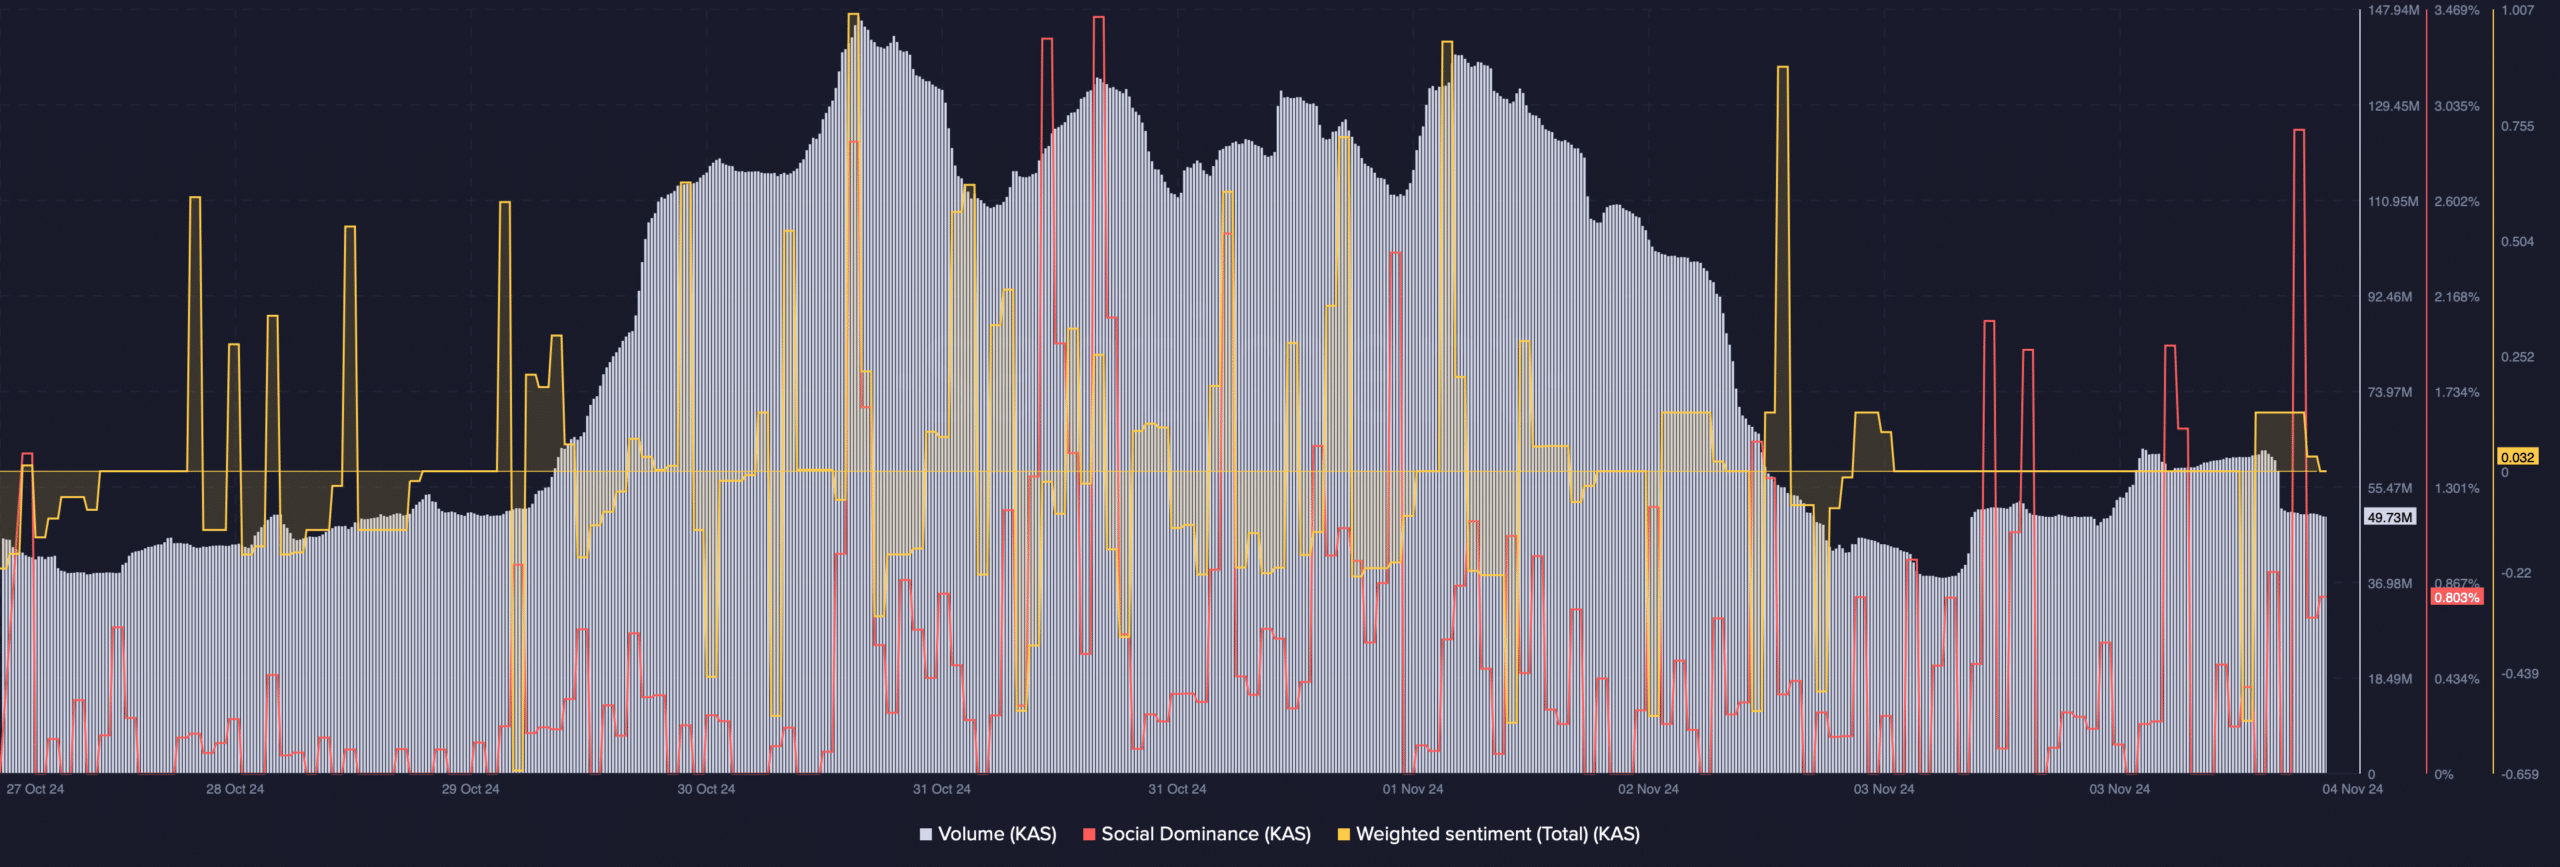
However, after this massive decline, a few of the on-chain metrics hinted at a bullish trend reversal. AMBCrypto’s analysis of Santiment’s data revealed that KAS’s social dominance increased, reflecting its popularity in the crypto space.
After a sharp decline, KAS’s weighted sentiment slipped into the positive zone – A sign that bullish sentiment around the token has been increasing.
After a sharp hike, Kaspa’s trading volume started to decline. A drop in the metric usually means a trend reversal.
AMBCrypto’s assessment of Coinglass’ data revealed quite a few other optimistic metrics as well. For example, KAS’s Open Interest declined. Whenever the metric falls, it means that the chances of the prevailing price changing are high.
Apart from these, we found that KAS’s long/short ratio started to climb. This suggested that there were more long positions in the market than short positions – A bullish signal.
Where is KAS heading?
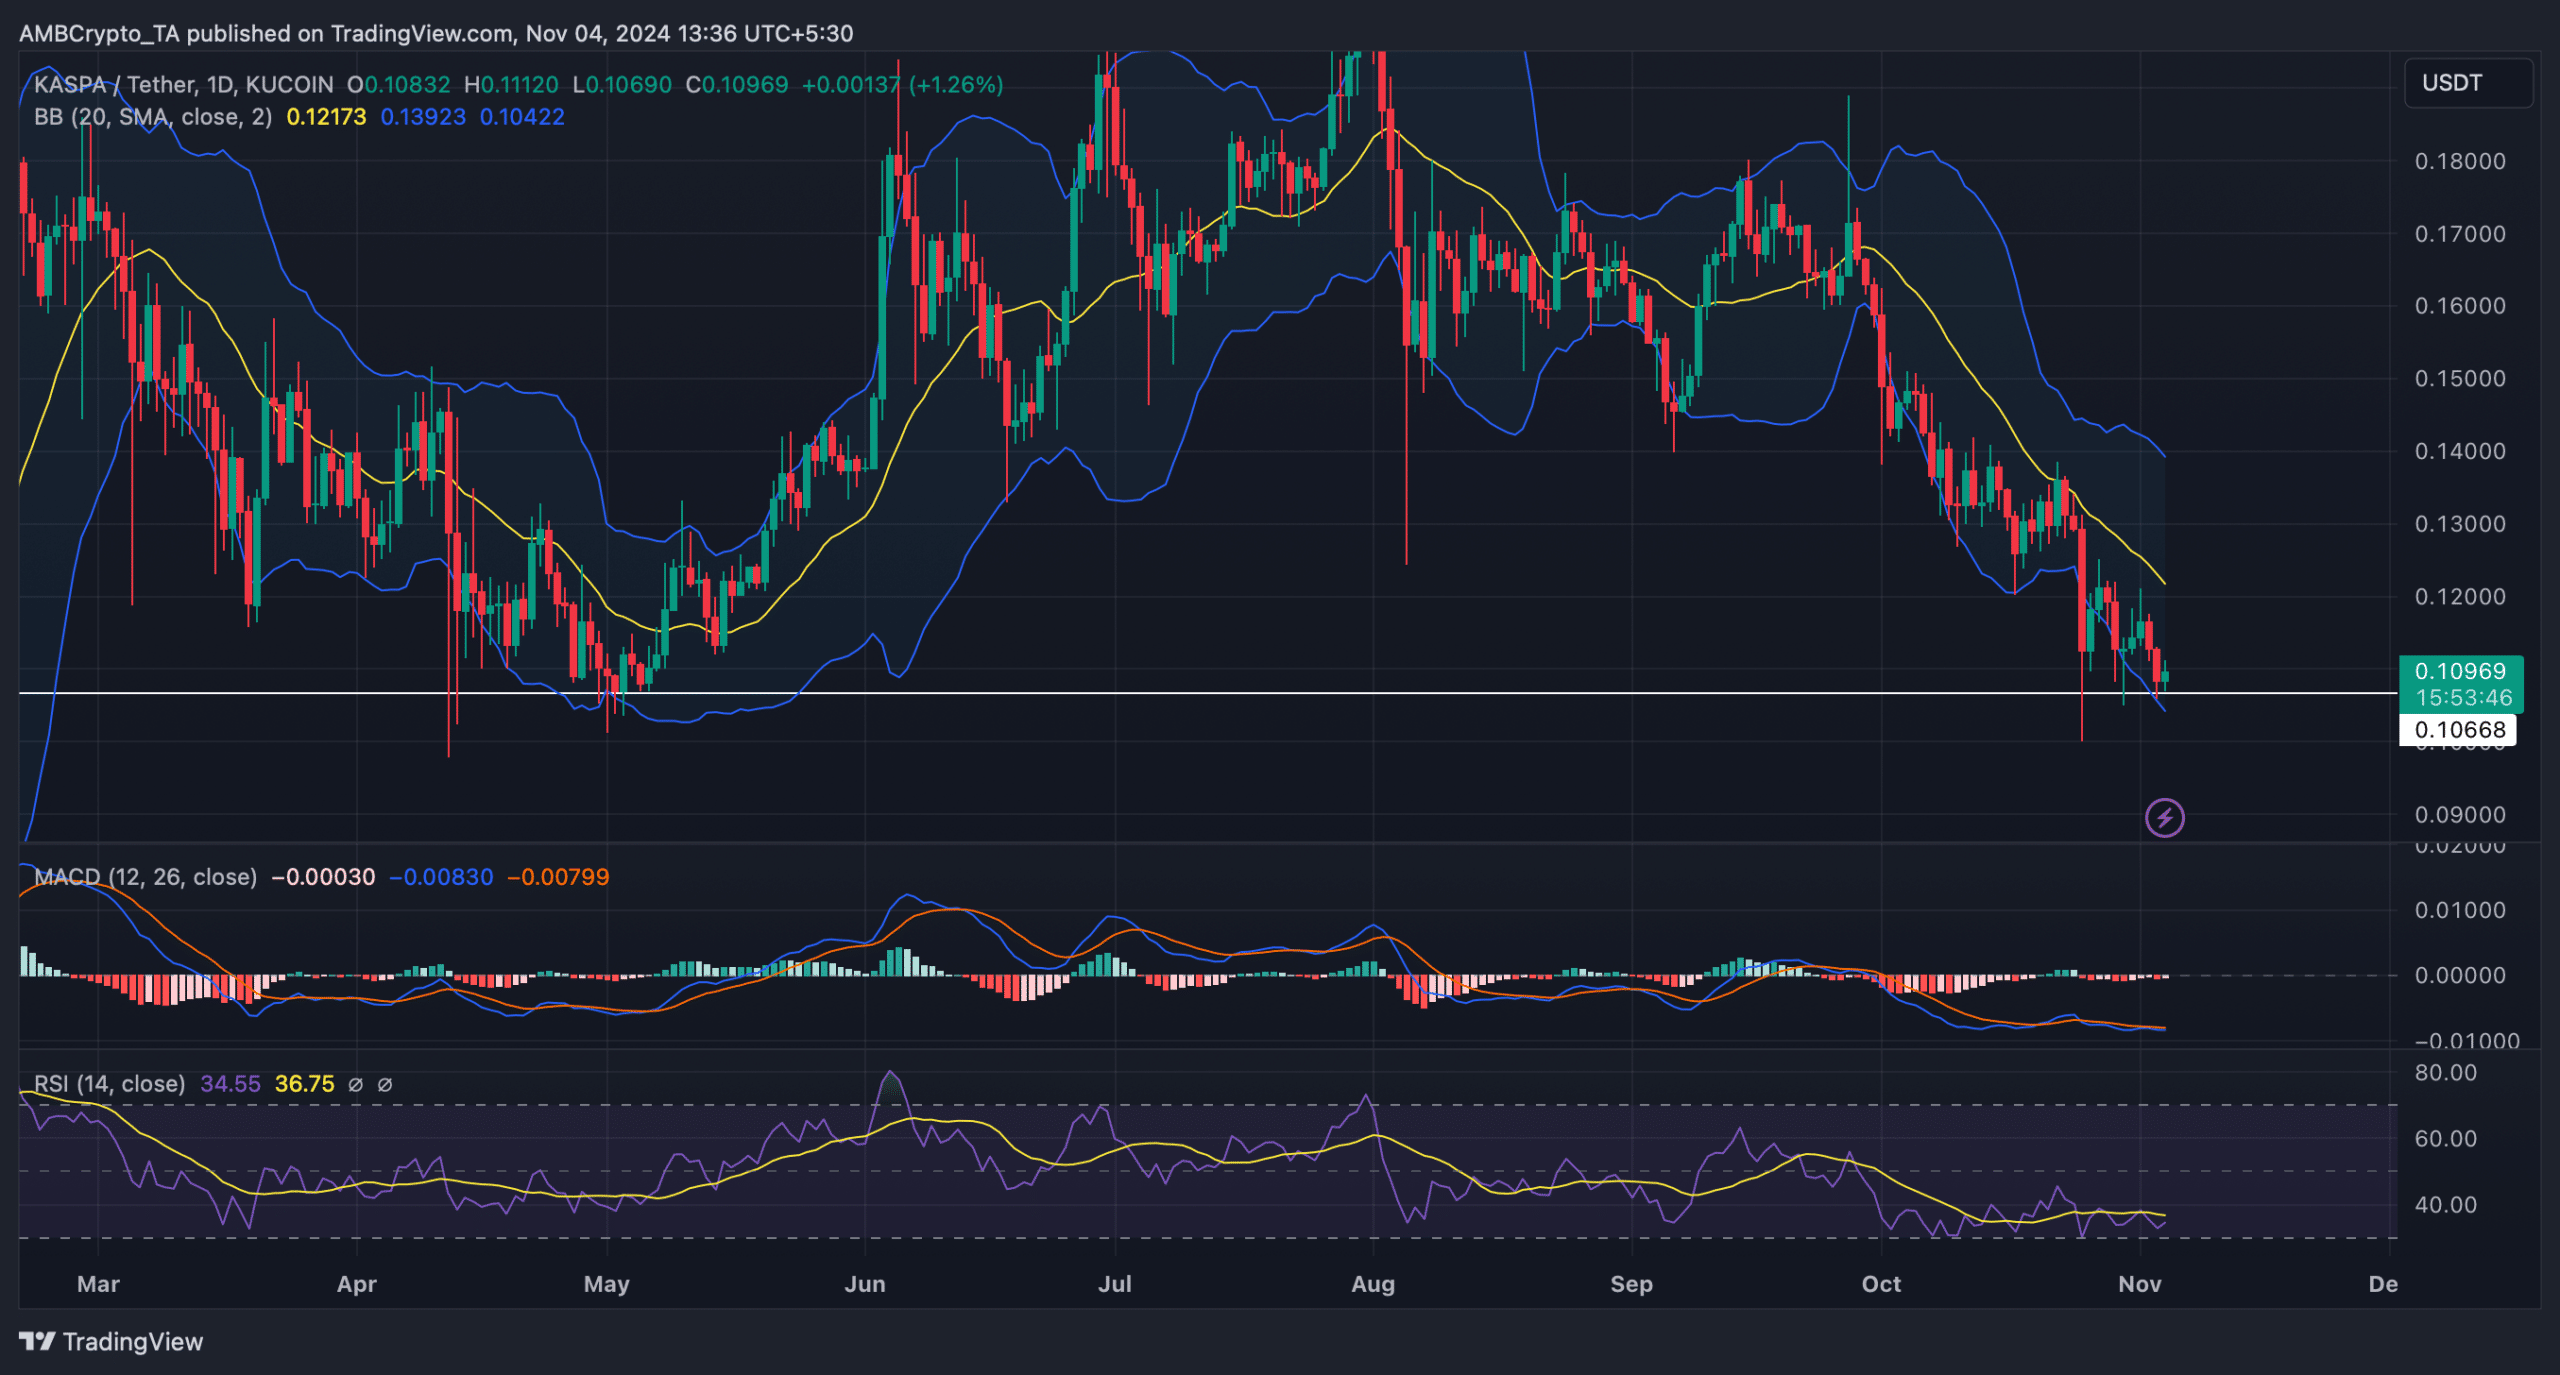
Finally, AMBCrypto checked KAS’s daily chart to find out whether technical indicators also hinted at a trend reversal. We found that Kaspa’s price touched the lower limit of the Bollinger Bands. In fact, the token was testing a crucial support at the time of writing. Such incidents are often followed by price hikes.
After a decline, the token’s Relative Strength Index (RSI) registered a slight uptick. Additionally, the technical indicator MACD projected the possibility of a bullish crossover.
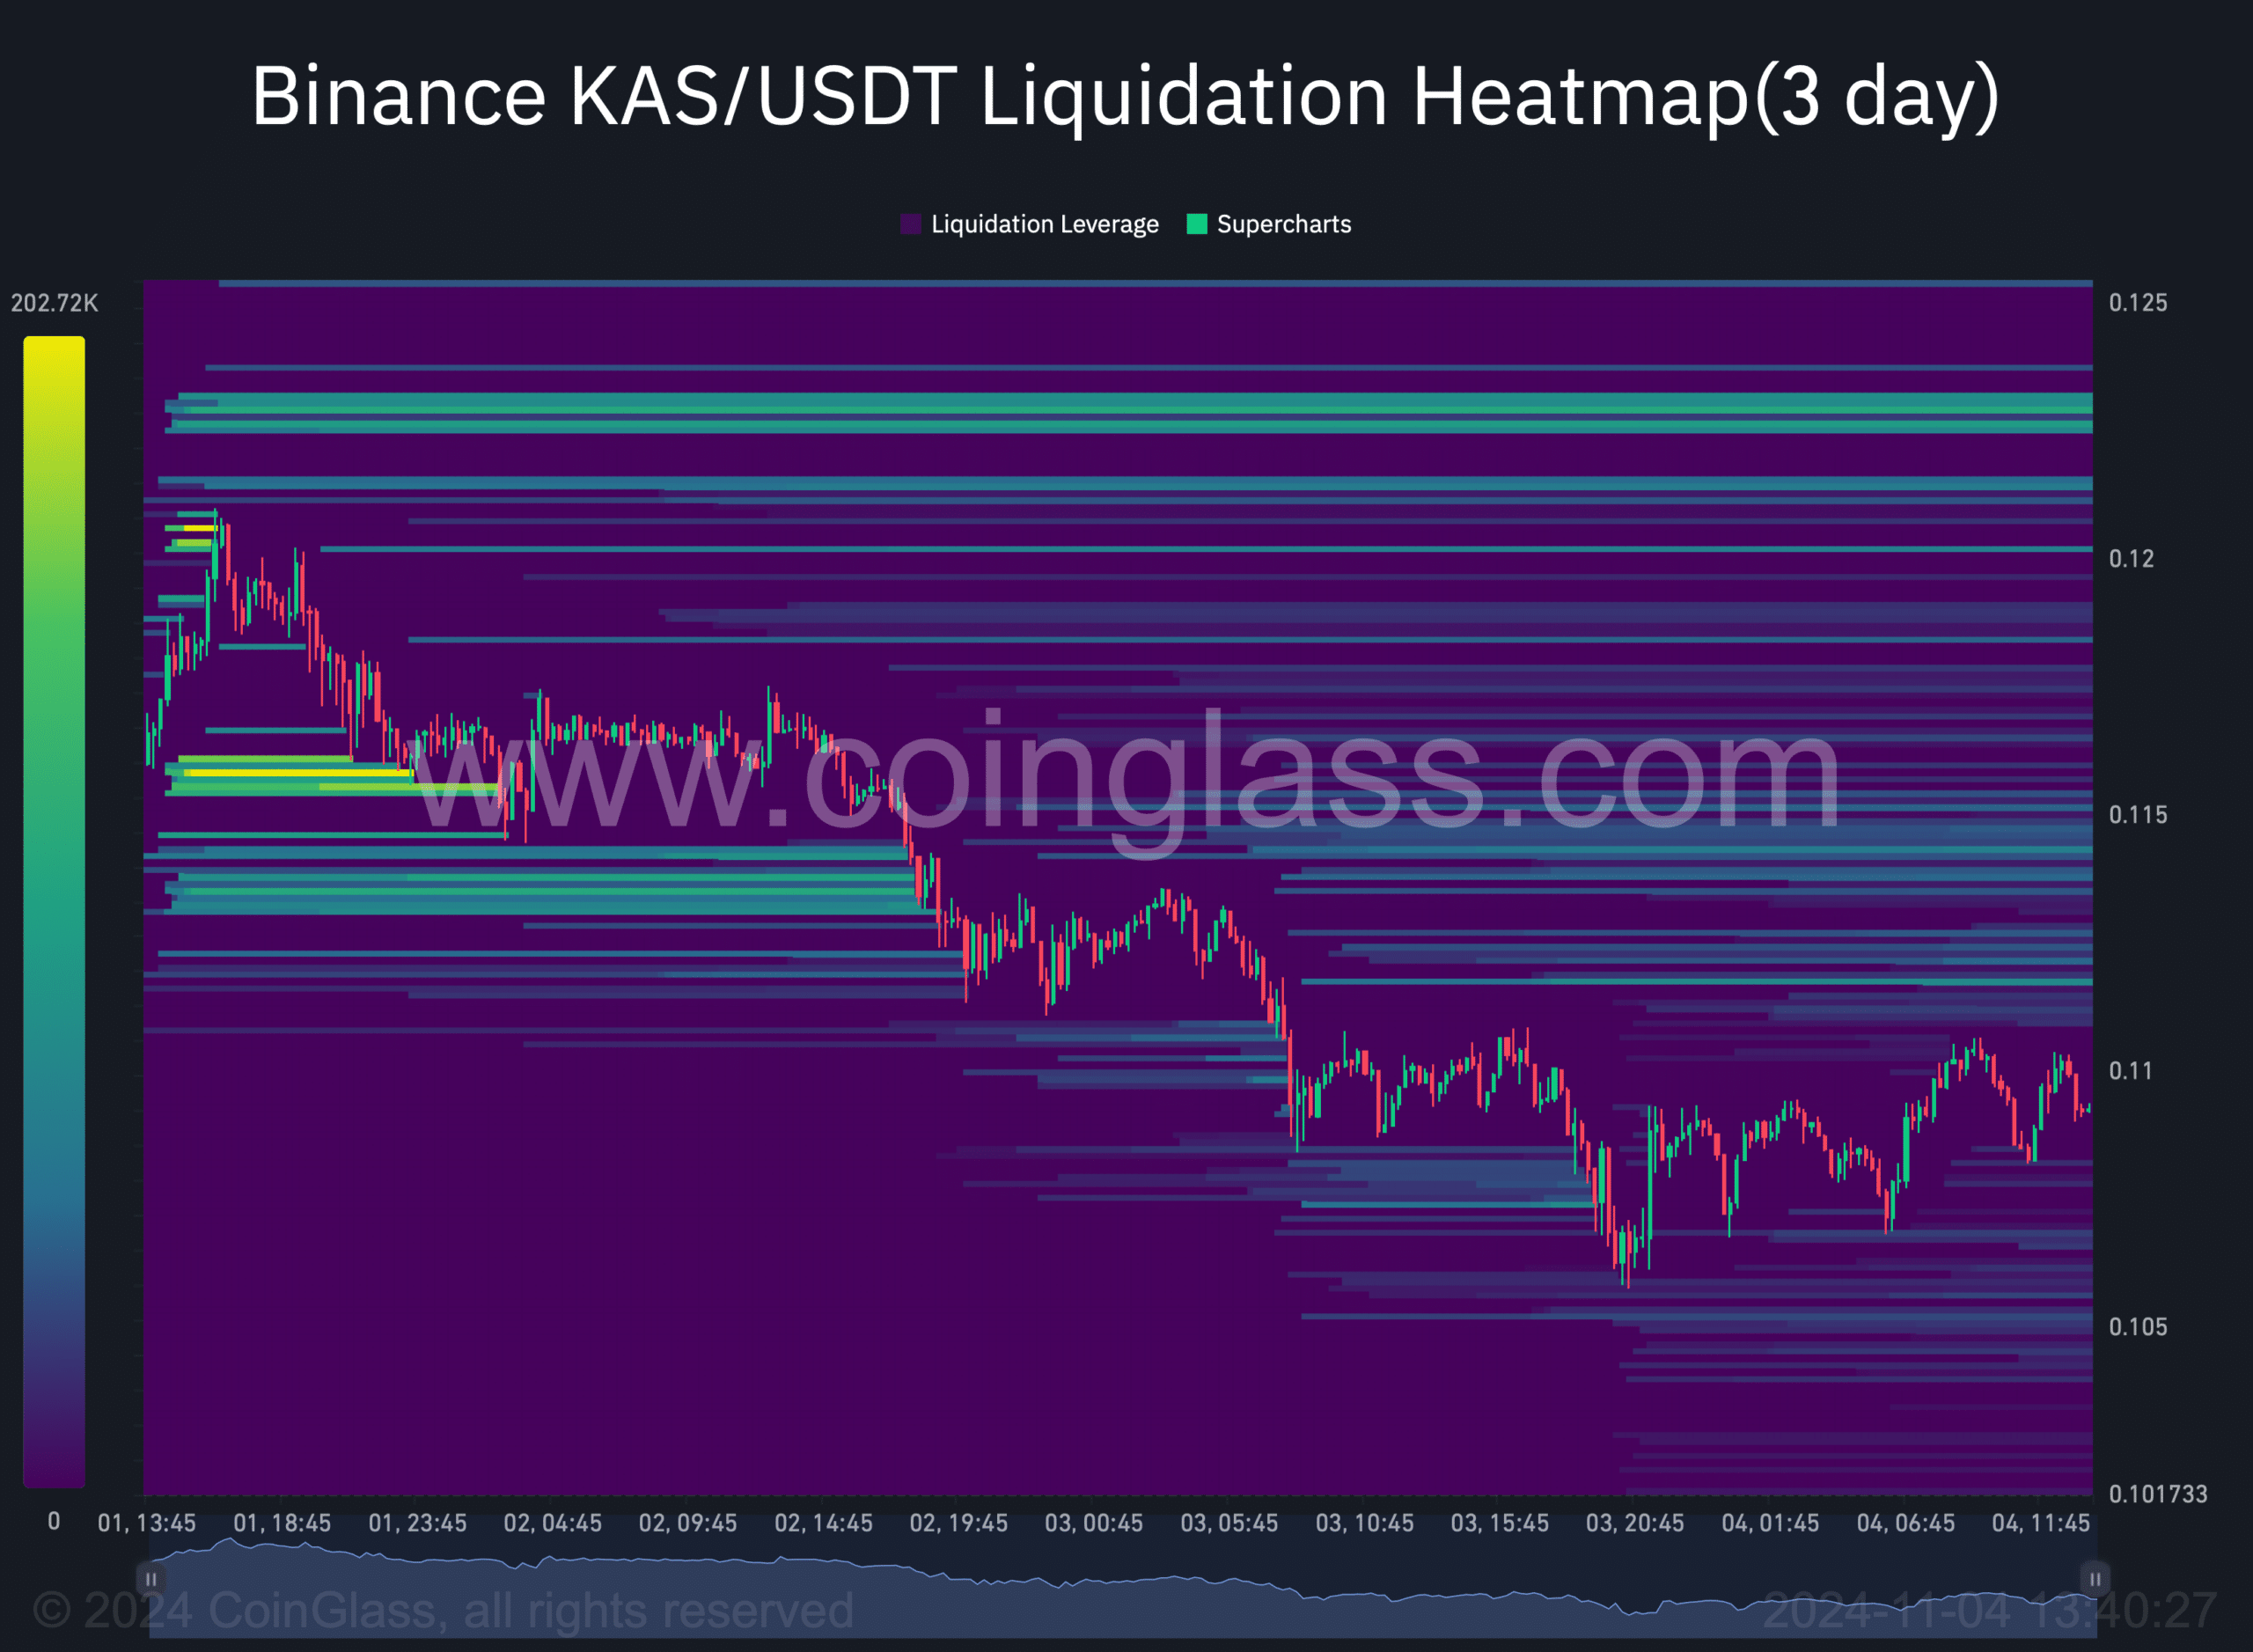
In case of a bullish trend reversal, it won’t be surprising to see KAS first target $0.122. This seemed to be the case, as Kaspa’s liquidations will rise sharply at that level.
Read Kaspa’s [KAS] Price Prediction 2024–2025
Usually, a hike in liquidations results in short-term price corrections. A hike above that resistance could push KAS towards its August high.


![Chainlink [LINK] price prediction - Watch out for a defense of THIS key level!](https://ambcrypto.com/wp-content/uploads/2025/04/Evans-17-min-400x240.png)
