Bonk coin up 19% in 24 hours: Here’s why a pullback could be next

- BONK is up by close to 30% this week.
- The daily structure combined with liquidation levels showed that the bulls might be stalled soon.
Bonk [BONK] fell below a key support level nearly a week ago and dropped 15% in three days. Since setting a local low on Monday, the 4th of November, the meme coin has rallied noticeably.
The U.S. election results could have an impact on Bitcoin [BTC] price trends. Short-term volatility threatens traders, but BTC’s bullish momentum could aid Bonk coin.
Bonk coin range failure and Fibonacci support levels
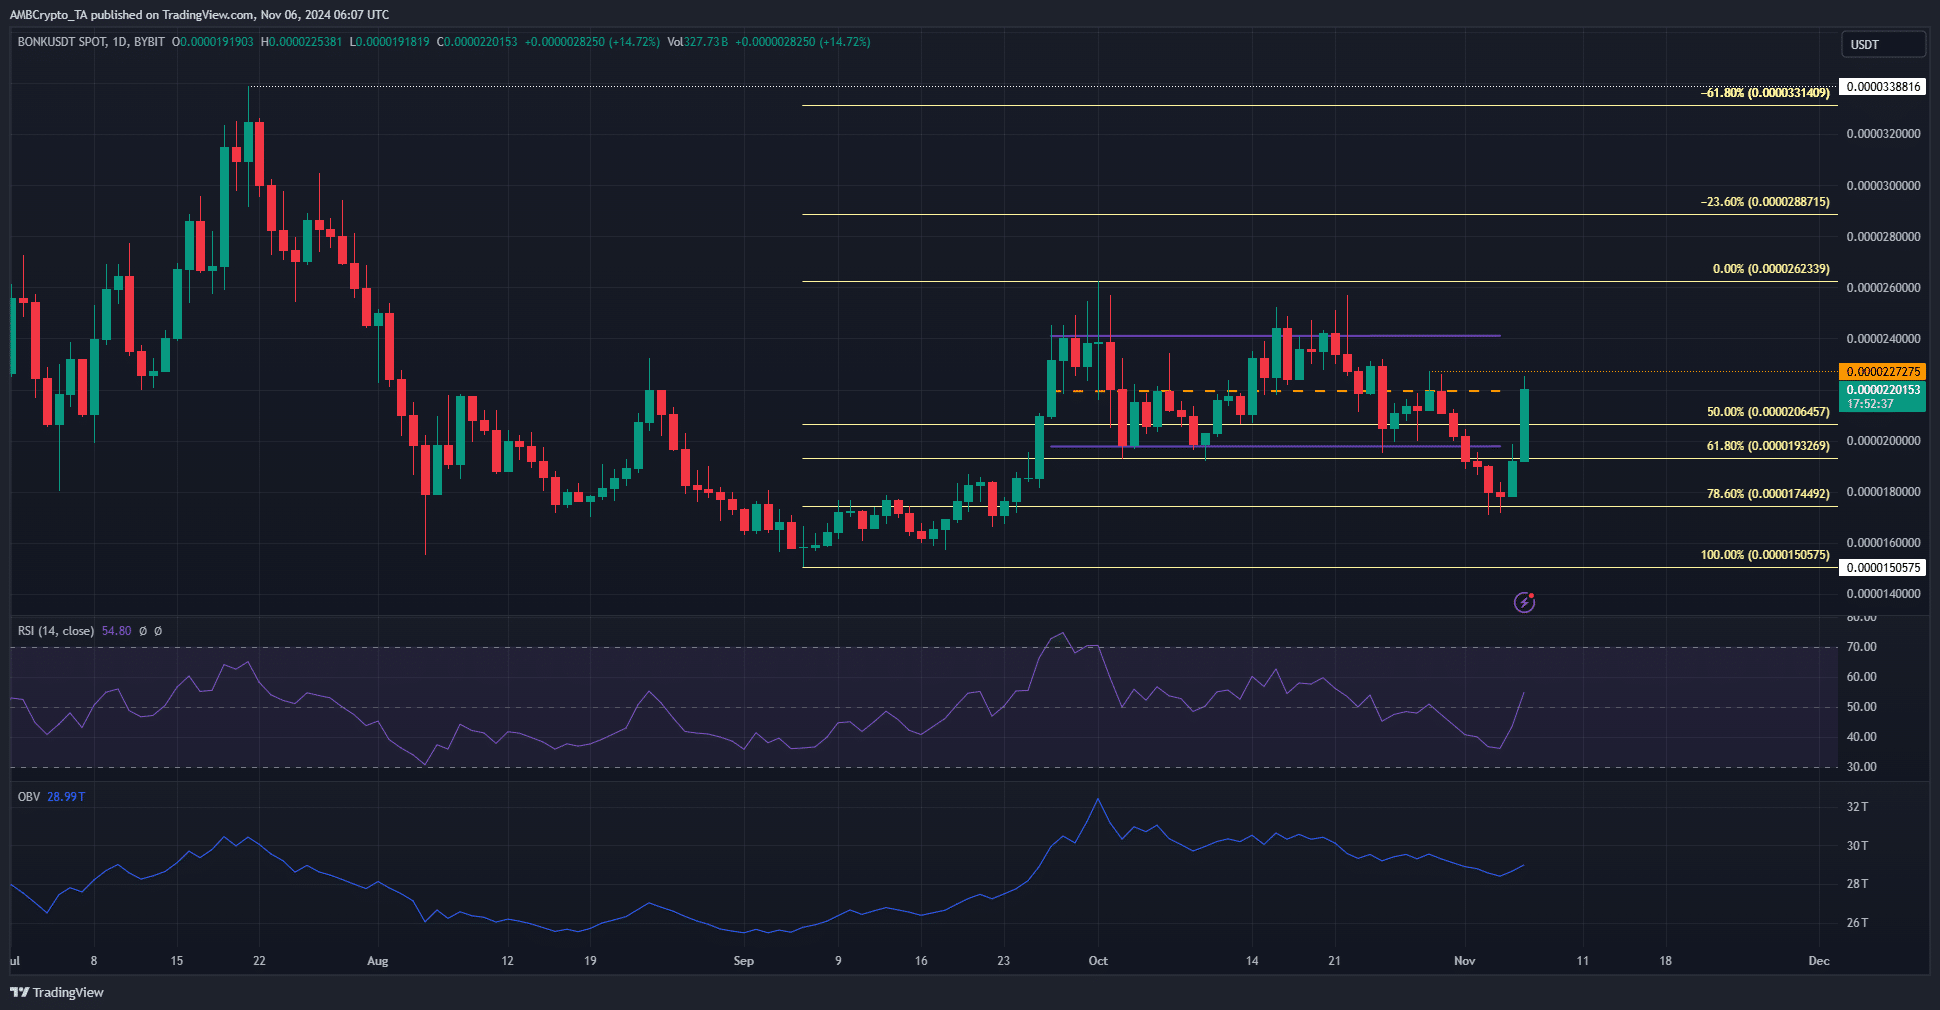
BONK had traded within a range (purple) in October that reached from $0.0000197 to $0.0000241. It fell below the lows of this range on the 1st of November. In doing so, it dropped as deep as the $0.0000174 level, the 78.6% Fibonacci retracement level.
The retracement levels were plotted based on the rally the meme coin saw in September. The 78.6% level offered an almost immediate bullish reaction. Over the past two days, BONK has gained 32.2% from its lows point at $0.0000171.
However, the market structure on the daily chart remained bearish. A daily session close above the lower high at $0.0000227 (dotted orange) would be a bullish structure break.
Despite this strong rebound, the OBV has maintained its downtrend. More buying volume might be necessary to push prices beyond the local highs around $0.000024. On the other hand, the RSI moved beyond neutral 50, a tentative sign of a momentum shift in favor of the buyers.
Former range highs likely to be critical once more
Source: Coinglass
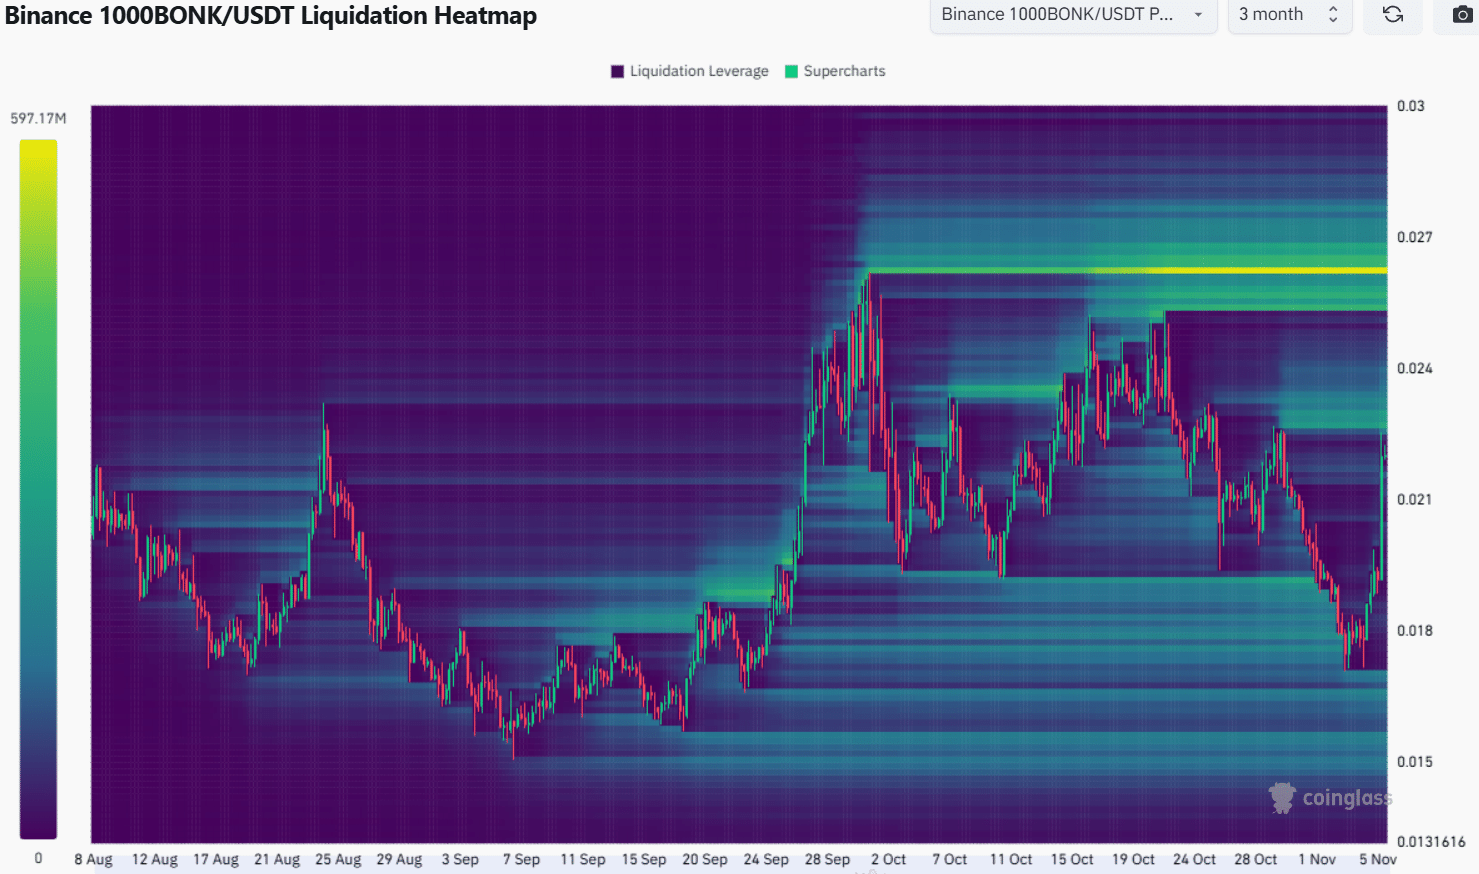
AMBCrypto’s analysis of the liquidation heatmap of the past three months showed that the $0.0000231 and $0.0000262 levels were the bullish targets. The former coincides with the local resistance zone.
Read Bonk’s [BONK] Price Prediction 2024-25
Moreover, the lack of significant buying volume recently meant that a reversal from $0.000023 was more likely than a breakout in the coming days.
Disclaimer: The information presented does not constitute financial, investment, trading, or other types of advice and is solely the writer’s opinion

