SAND’s uptrend: Analyzing the potential for a New ATH
Sandbox (SAND) gains momentum, with $0.50 in sight if it clears $0.35.

- SAND shows strong momentum following a falling wedge breakout, with resistance at $0.35.
- Onchain metrics bolster the bullish case, while reduced exchange reserves limit selling pressure.
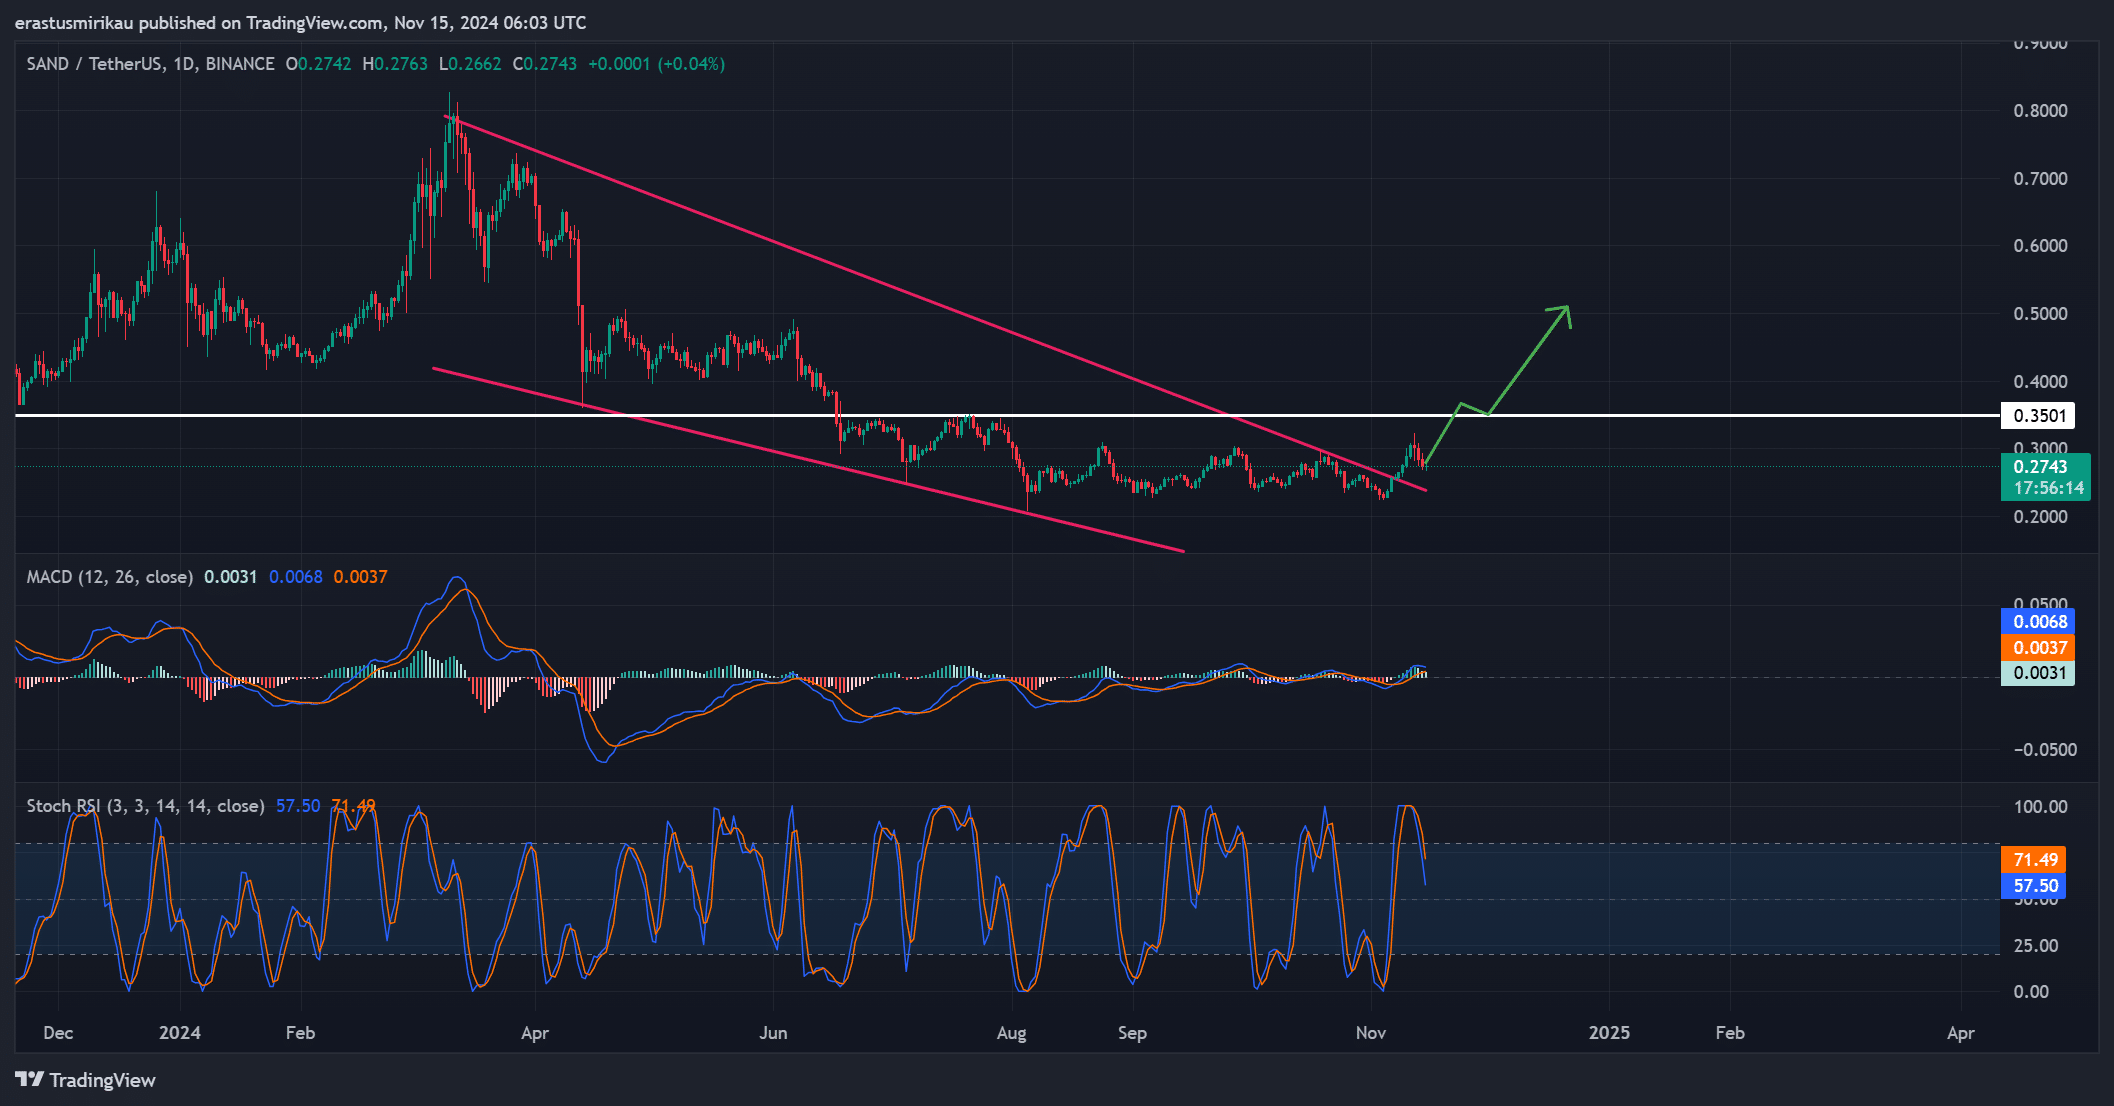
The Sandbox [SAND] is gaining momentum after breaking out from a falling wedge pattern, signaling a potential bullish reversal. Currently consolidating around $0.27, SAND is holding firm above the 50-day moving average, suggesting that further upward movement could be imminent.
Technical analysis: Can SAND break past $0.35?
After breaking out of the falling wedge pattern, Sandbox faces a critical resistance at $0.35. A successful breach of this level could open the doors for an ambitious target of $0.50, representing substantial upside potential.
The Stochastic RSI also reflects a favorable sentiment, sitting near overbought territory but indicating that buying interest remains strong.
Meanwhile, the MACD histogram shows positive momentum, supporting the possibility of further gains if buying pressure continues.
If SAND sustains its position above the 50-day moving average, it would further bolster the bullish outlook, paving the way for a rally toward $0.50.
However, failure to clear the $0.35 resistance could lead to some retracement, with potential support around $0.27.
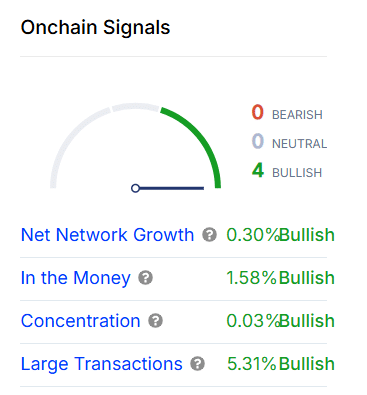
Bullish onchain signals strengthen Sandbox’s outlook
Onchain data aligns with the technical setup, showing bullish metrics across the board. Net network growth is up by 0.30%, indicating rising engagement within the ecosystem.
Additionally, 1.58% of Sandbox holders are “in the money,” reflecting profitable positions that could fuel positive sentiment.
Concentration and large transactions are both in the green, with a notable 5.31% increase in large transactions, suggesting interest from larger players and institutional investors.
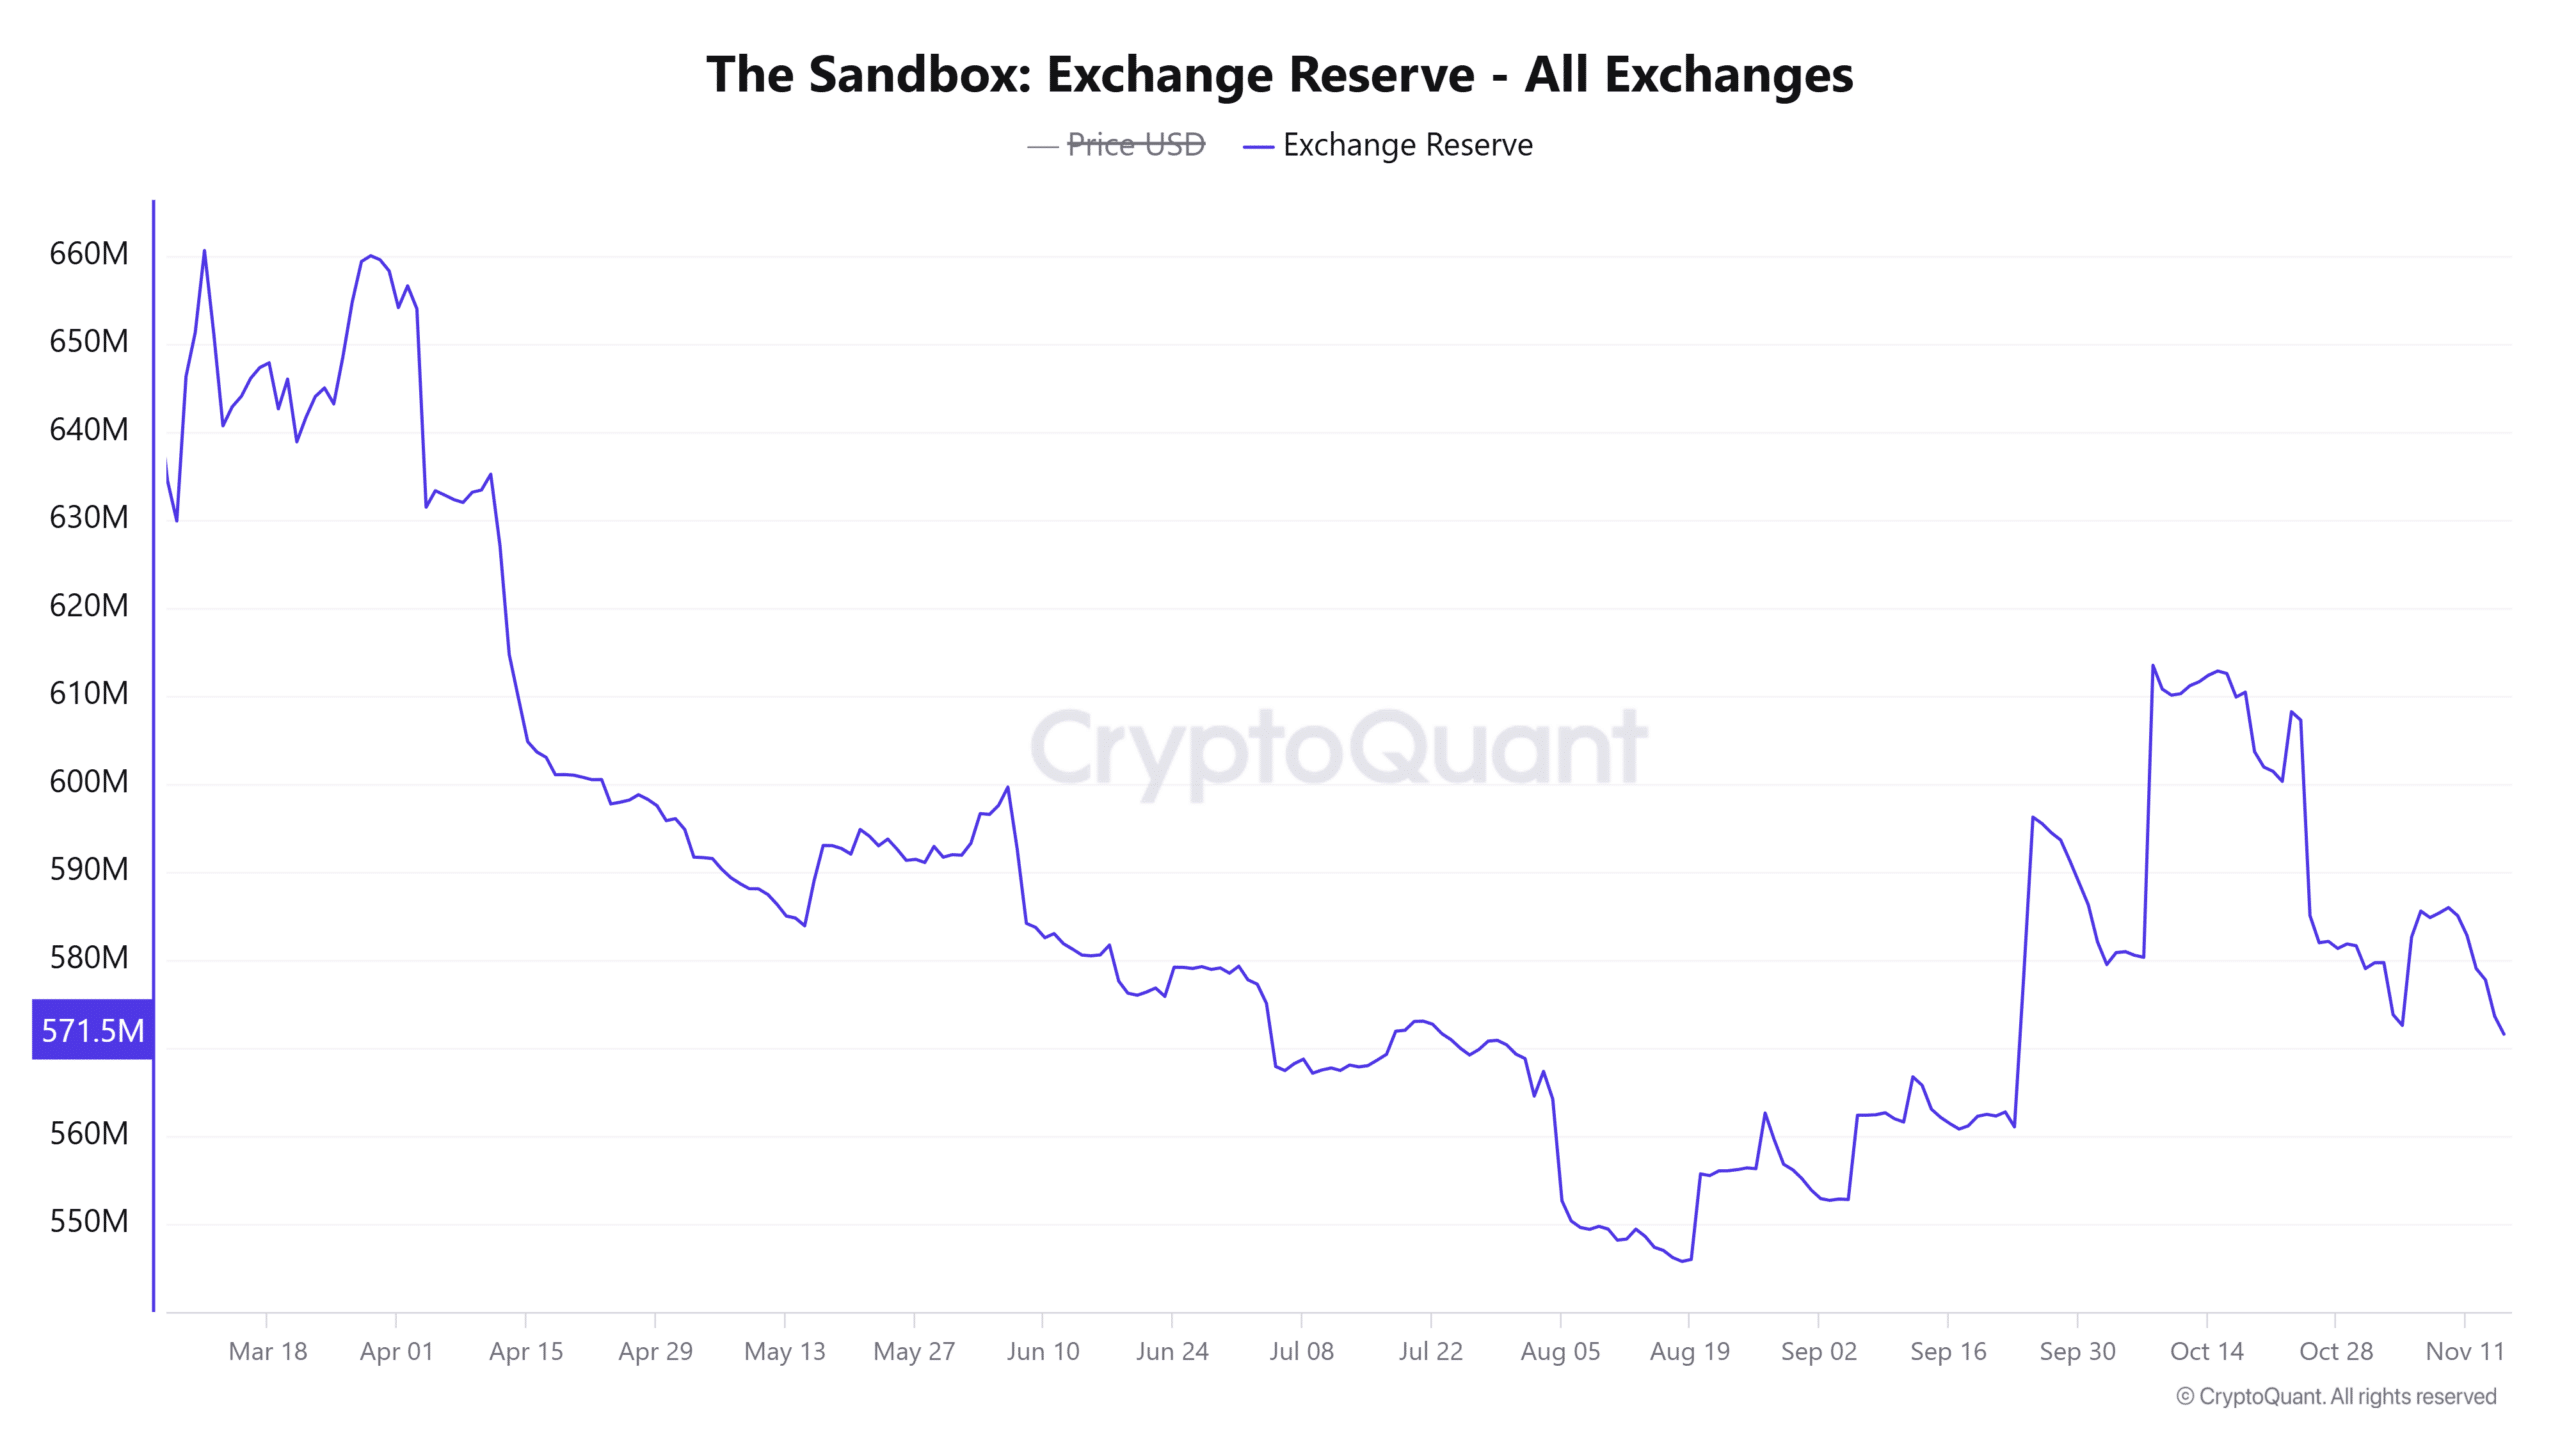
Another bullish factor is the decline in SAND’s exchange reserves, which have decreased by 0.94% over the past 24 hours.
This reduction indicates fewer SAND tokens available on exchanges, potentially reducing selling pressure and allowing for a smoother upward move if buying demand remains steady.
Realistic or not, here’s SAND market cap in BTC’s terms
SAND’s path toward $0.50 looks promising
The Sandbox is positioned for a bullish move as both technical indicators and onchain metrics align favorably. With $0.35 as the key resistance level to watch, a successful breakout here would solidify the path toward the $0.50 target.
Given the current bullish sentiment and metrics, SAND appears well-supported to reach this milestone, provided buying momentum holds steady.