XLM outperforms Bitcoin in November: Will its rally hold up amid caution?

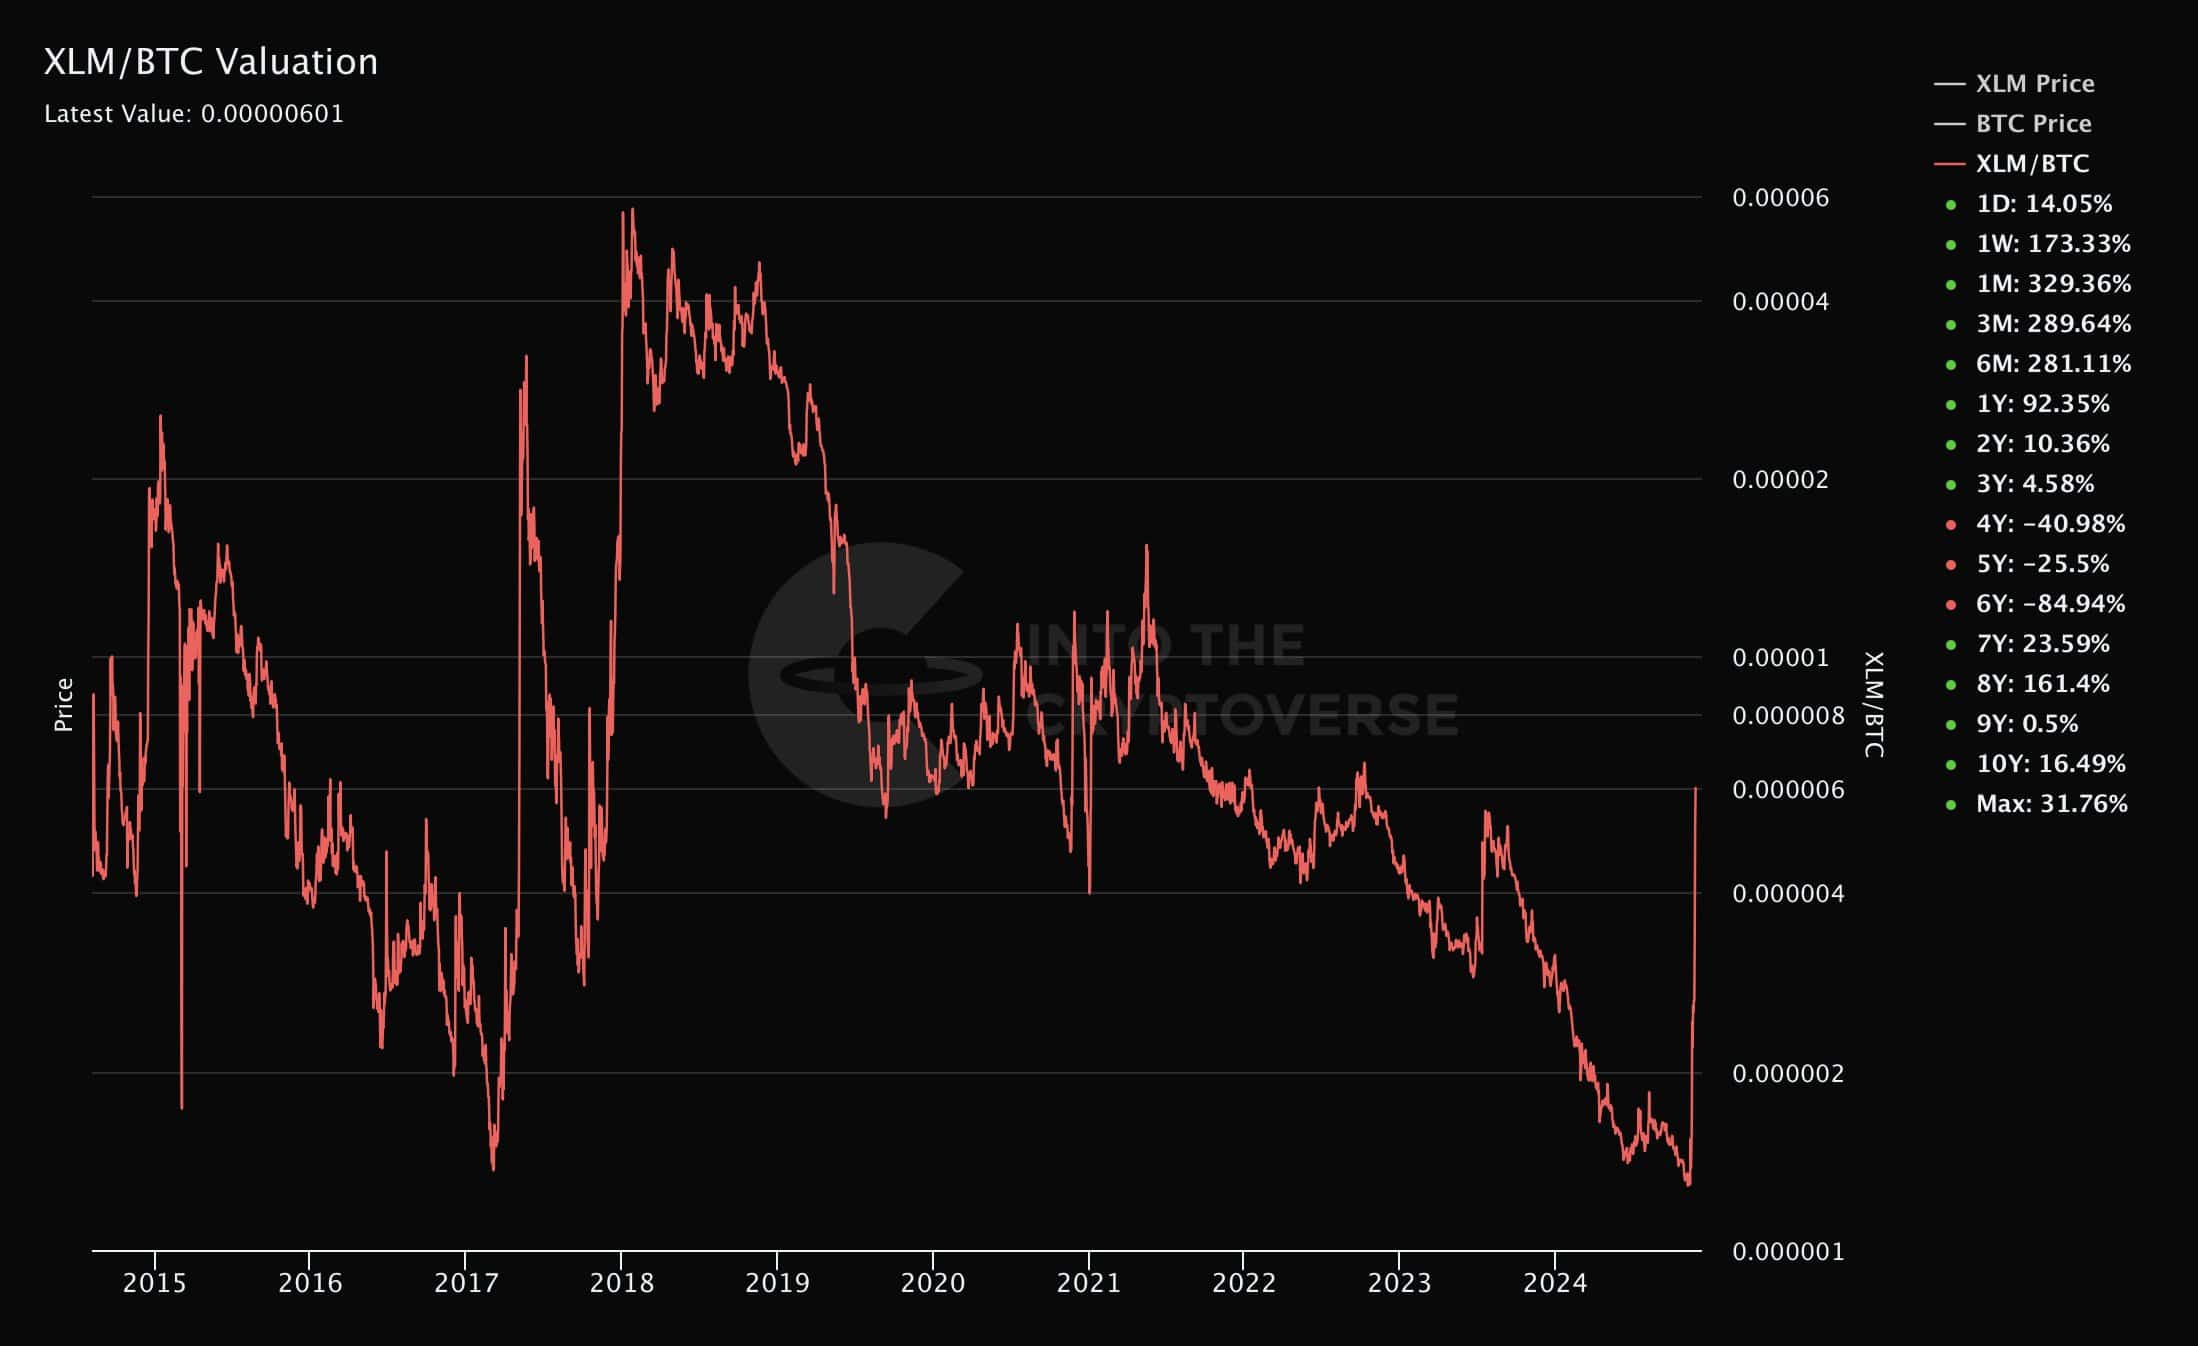
- XLM valuation against Bitcoin showed decent ascent since start of November.
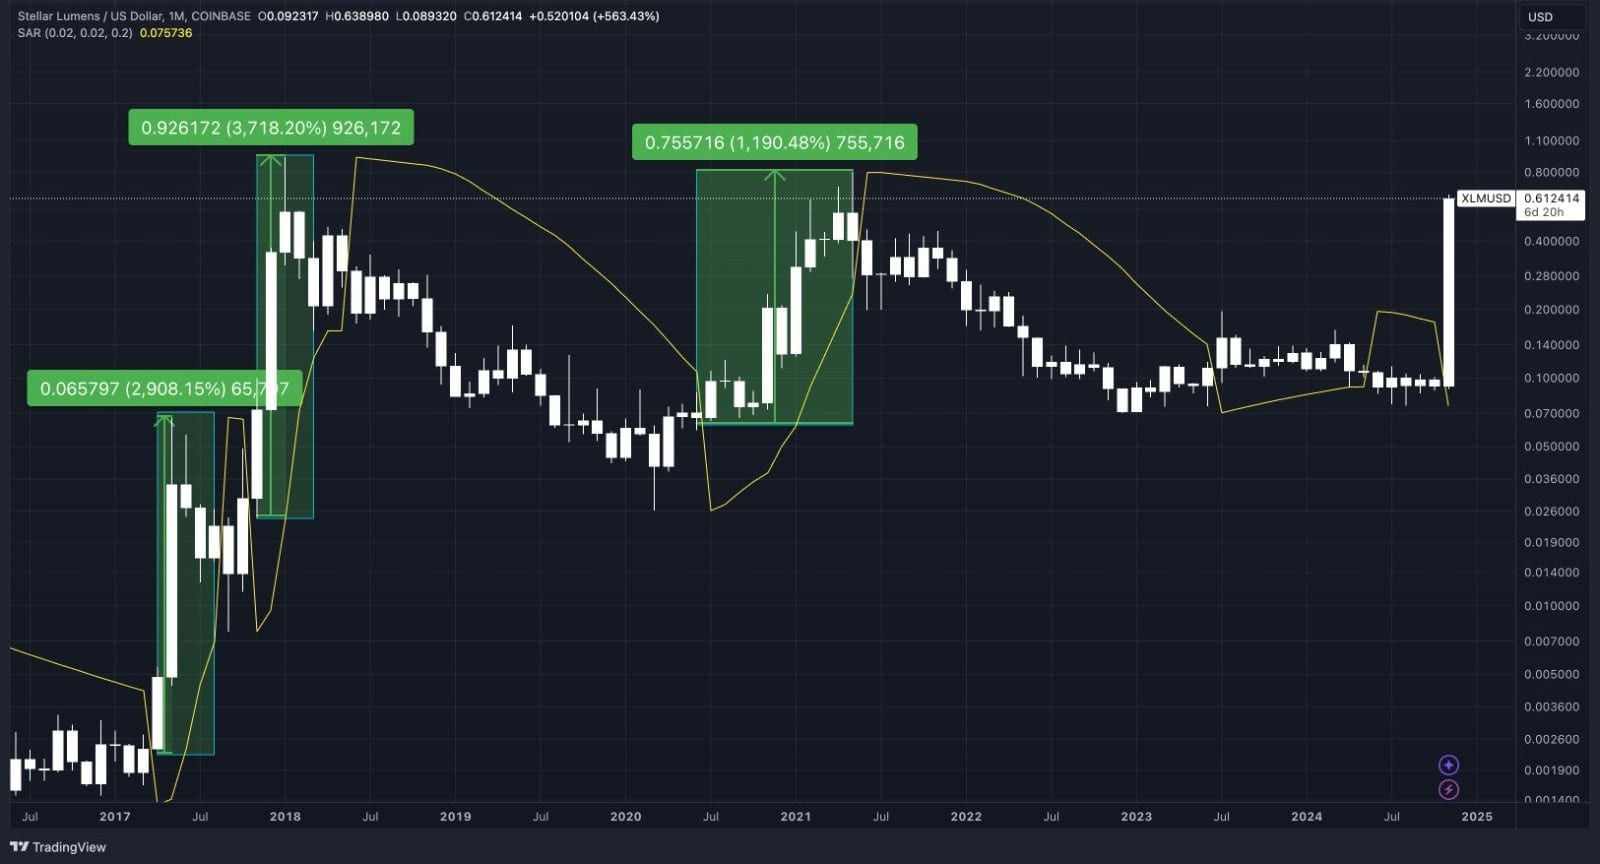
- XLM crossed above the Parabolic SAR once again, suggesting continued bullishness.
Stellar Lumens [XLM] showed a decent ascent in its valuation against Bitcoin since the start of November. XLM’s outperformance of Bitcoin, marked a positive shift in it’s market sentiment.
This uptrend reflected a resurgence in investor interest, as Stellar Lumens navigated away from previous lows to challenge new resistance levels.
Recent trading activity pushed XLM’s valuation to heights not seen in months, sparking discussions about its potential to sustain these gains. The chart detailed a breach of the series of lower highs and lower lows—a bullish indicator in market technicals.
The key question remained: Can Stellar Lumens continue its ascent towards more robust valuation benchmarks against Bitcoin?
XLM faces potential bubble burst
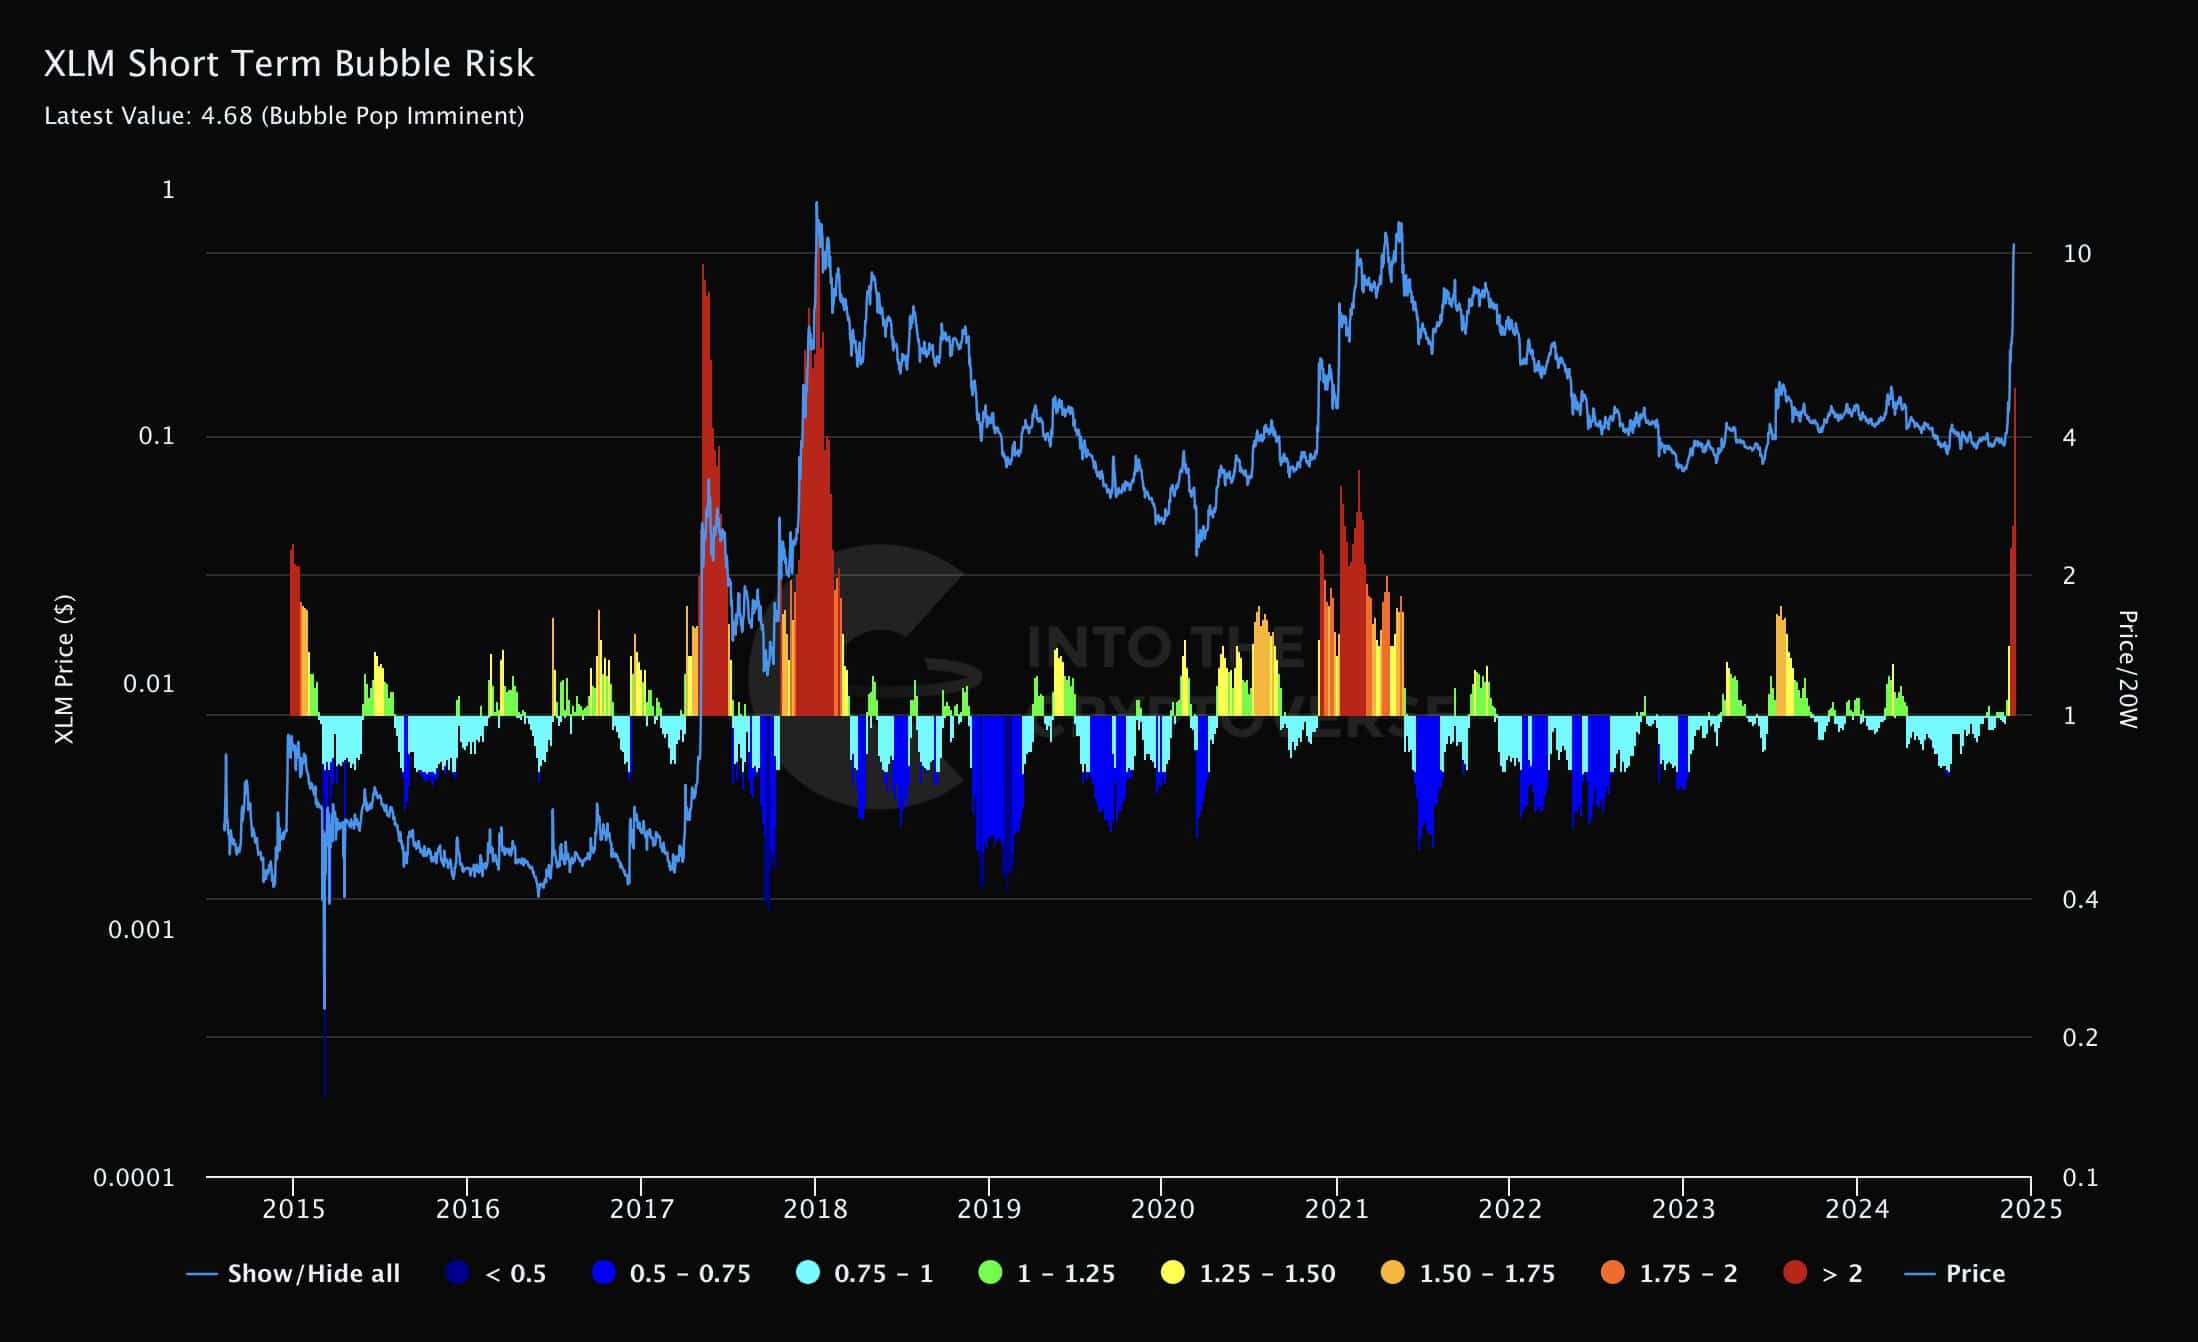
Despite Stellar Lumens outperforming Bitcoin in terms of valuation, the short-term bubble risk indicator spiked to 4.68, signaling that a bubble pop could be imminent.
This high risk score warned investors that although Stellar Lumens was looking to find some support around the $0.5 level, entering long positions may still be precarious unless this price level is firmly established as the floor for future advances.
As Stellar Lumens price action unfolds, traders should monitor the $0.5 support zone closely, as a confirmed stabilization here could open the door for more sustained uptrend.
The chart analysis highlights critical risk points that could influence XLM’s price trajectory significantly in the near term.
Price prediction and drawdown from ATH
XLM showed volatility, aligning with the Parabolic SAR’s monthly signals. XLM crossed above the Parabolic SAR once again, suggesting continued bullish surge.
Historically, each time XLM exceeded this threshold, a peak was often reached, followed by a decline. However, the short-term bubble risk indicator spiked concurrently, warning of a potential retracement.
The pattern indicated that waiting for Stellar Lumens to retrace below the Parabolic SAR or stabilize could be prudent before expecting further rallies.
This cyclic behavior suggested the importance of strategic entries and exits in the volatile crypto market, especially when key indicators signal a shift.
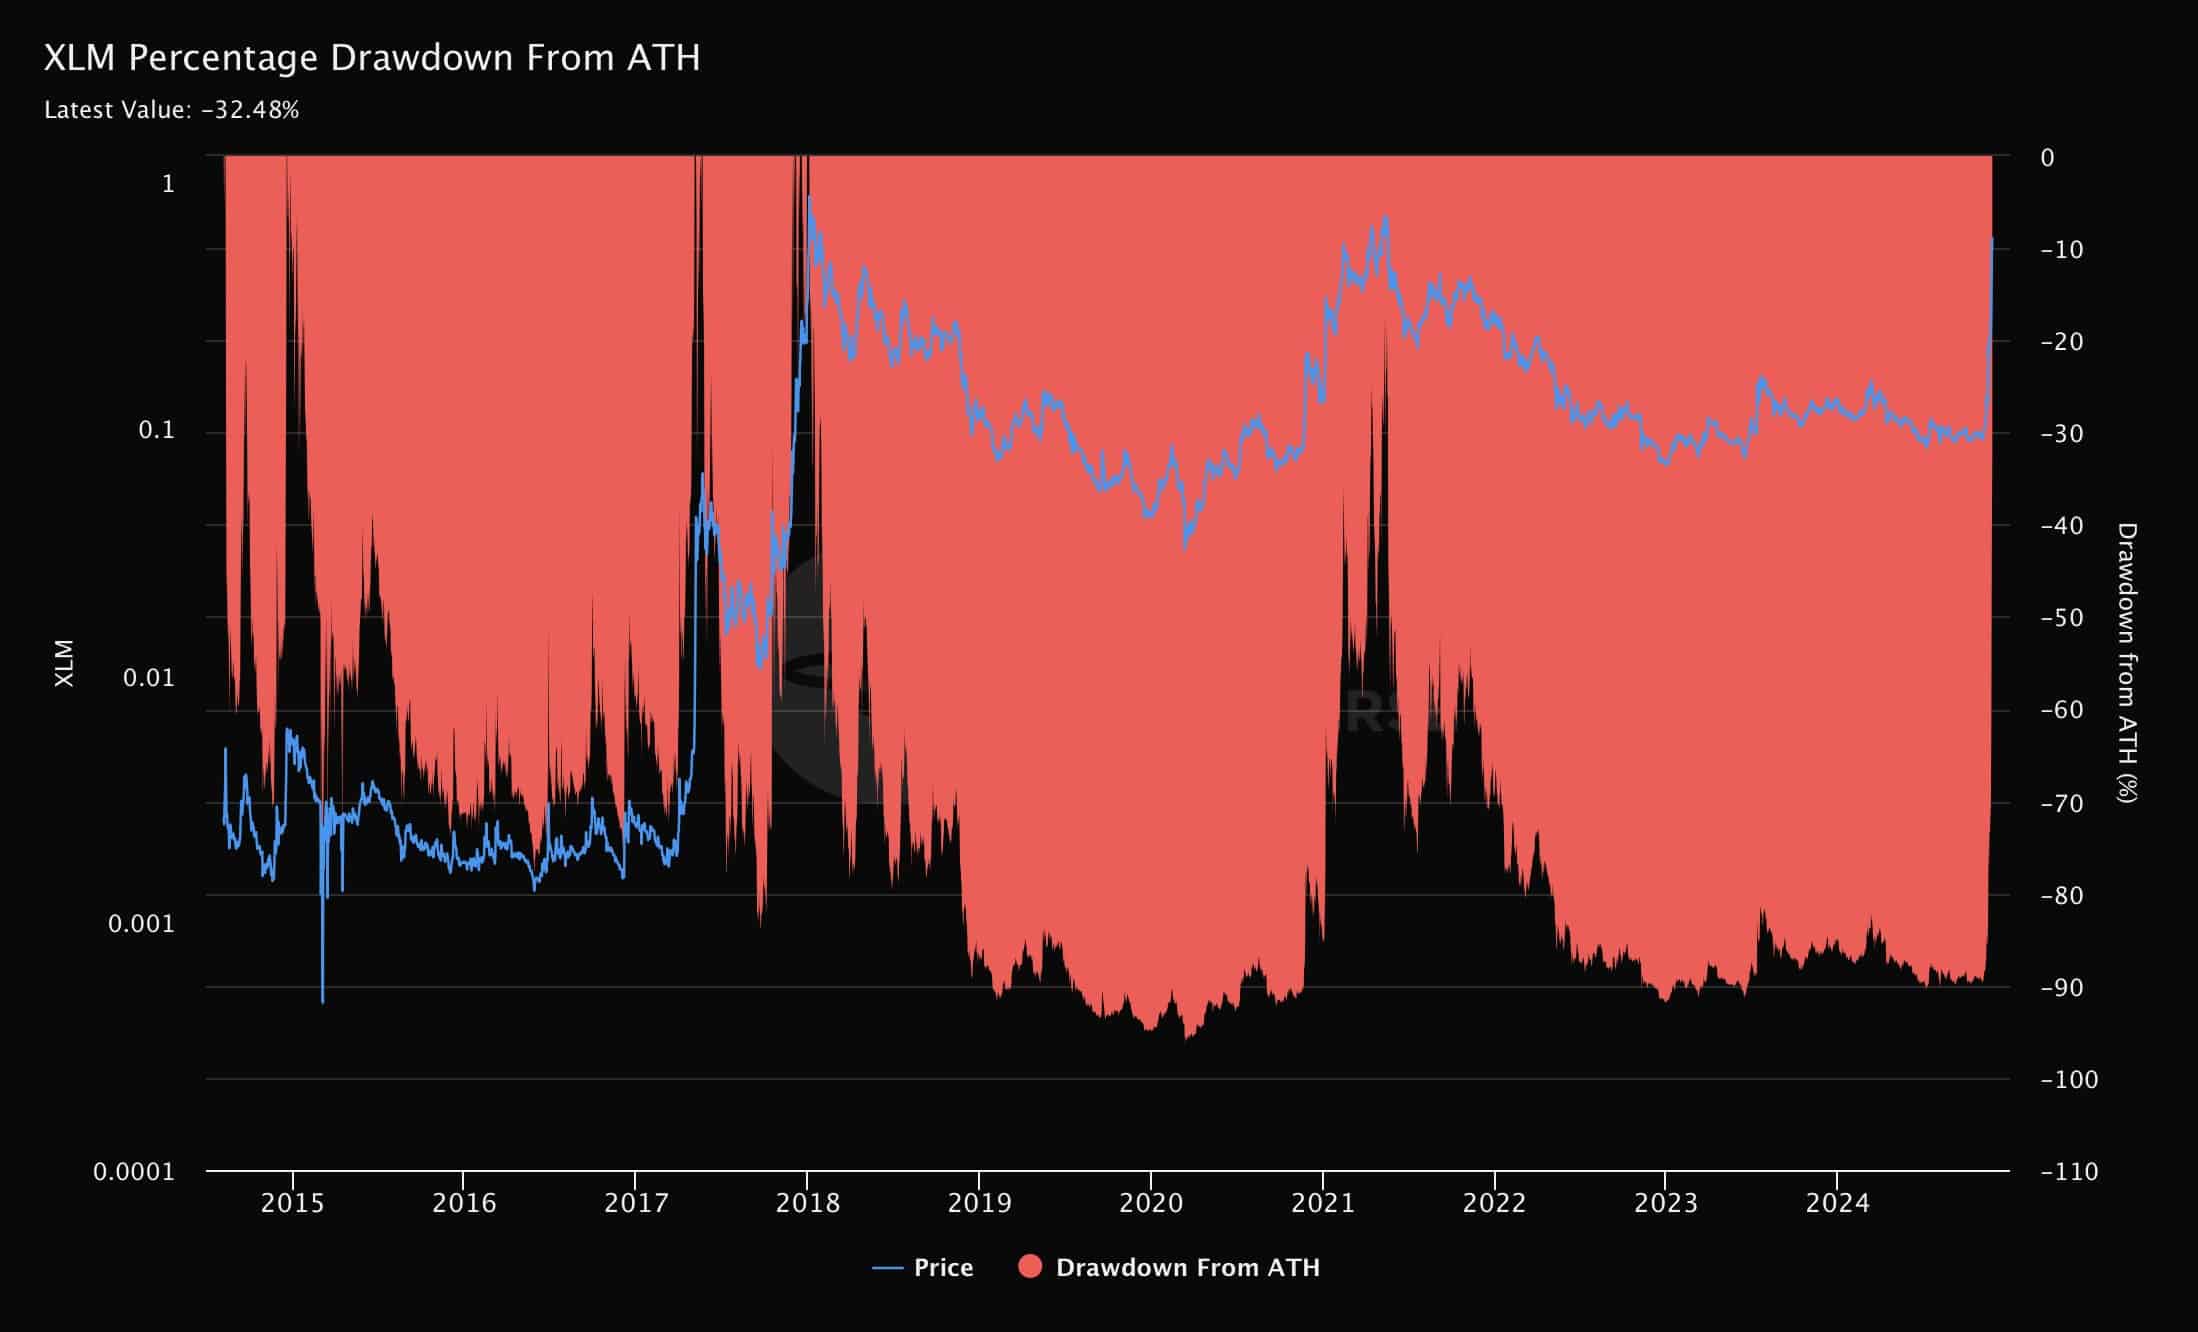
Additionally, the performance of XLM reduced its drawdown from ATH to just 32.48%. This was crucial given the historic volatility in XLM’s pricing, which saw substantial peaks and troughs over the years.
The chart reflected periods of sharp increases in XLM’s value, followed by equally rapid declines, typically associated with broader market trends.
Read Stellar’s [XLM] Price Prediction 2024–2025
The current reduction in percentage drawdown indicated a positive recovery trend, suggesting that XLM was regaining value from its lowest points more effectively compared to past performances.
This recovery could be indicative of growing investor confidence and a stabilizing market position for XLM.


![Is Tezos [XTZ] crypto poised for a correction? Key data says...](https://ambcrypto.com/wp-content/uploads/2024/11/Chandan-XTZ-400x240.webp)
