BONK price prediction – What are the odds of market bulls flipping THIS level?
- BONK’s RSI and OBV revealed strong bearishness over the past month
- A bounce to $0.00004 might be likely, but whether the market structure can shift bullishly would depend on capital inflows
BONK fell by 59% in 30 days from 20 November to 20 December. This steady downtrend saw some sizeable selling volume on certain days, such as 9 December, when Bitcoin [BTC] faced rejection from the $100k- level.
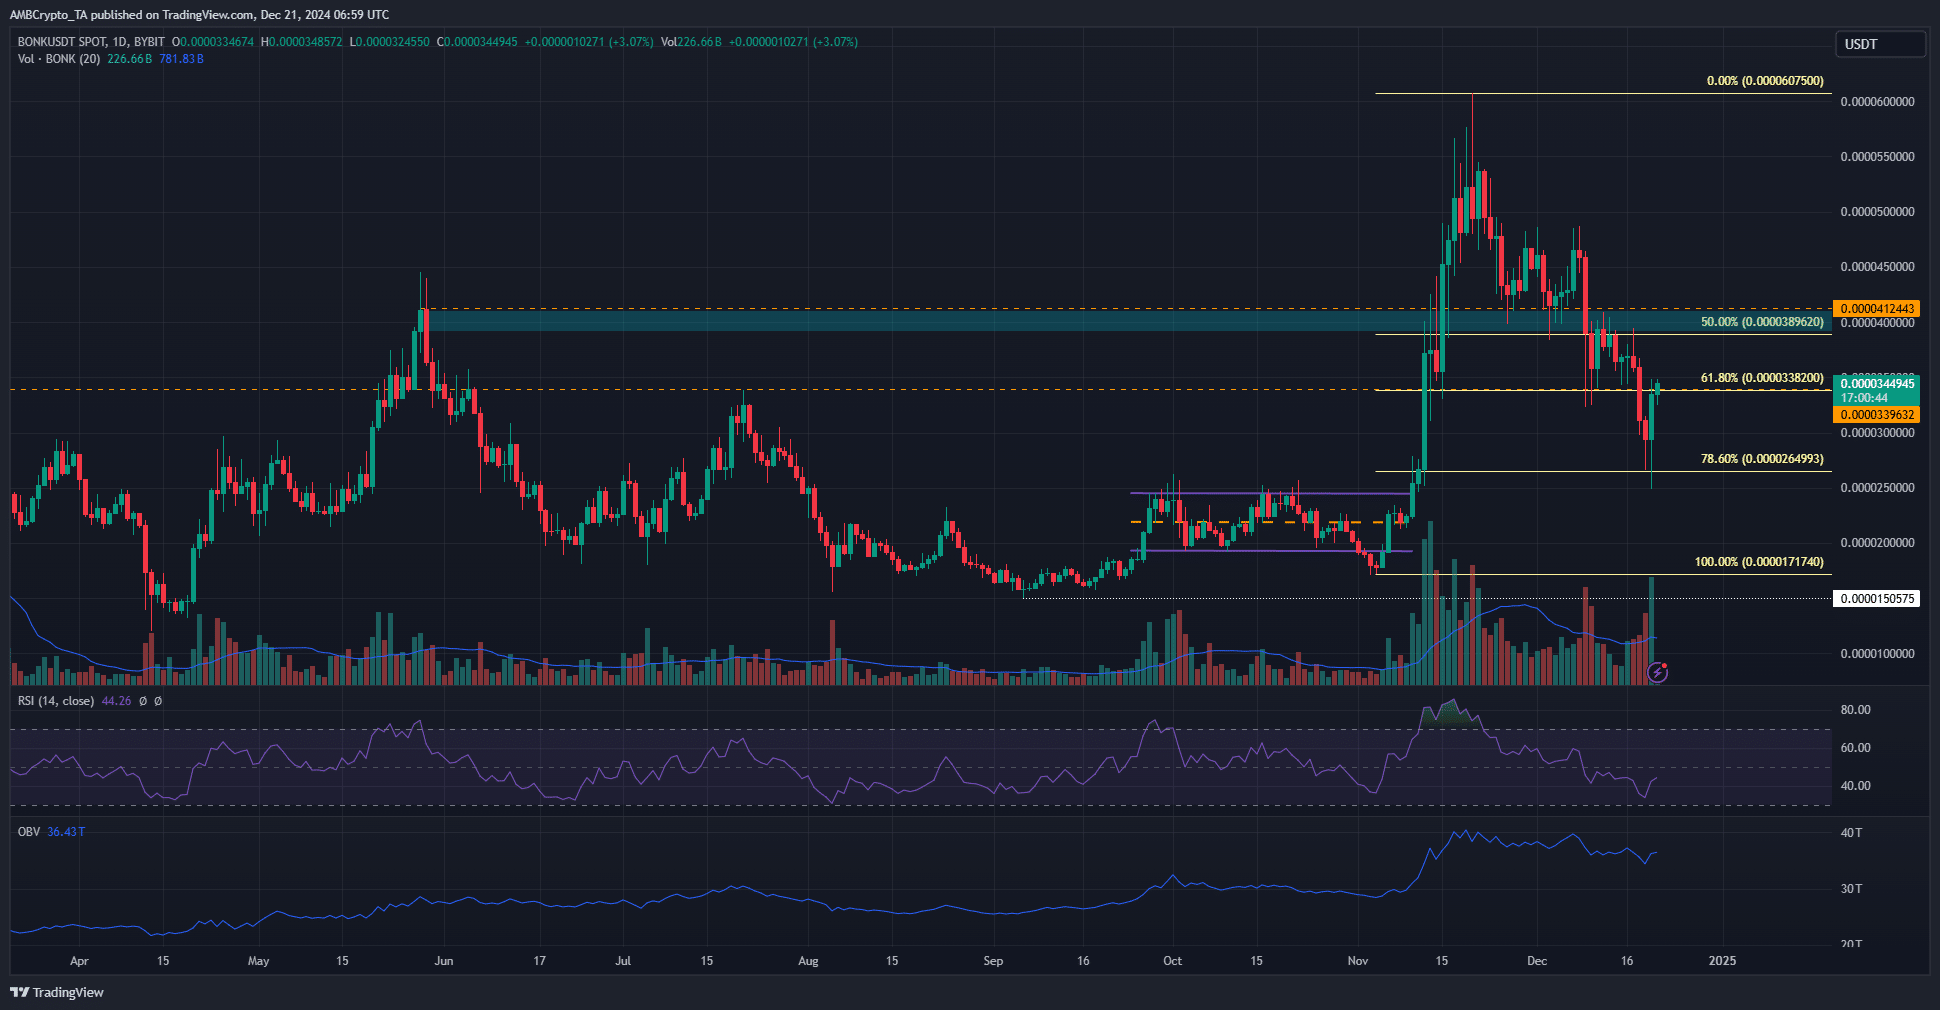
Since then, the memecoin has struggled to hold key support levels. In fact, the latest BTC correction sent BONK to another vital support level at $0.0000265.
BONK bulls attempt to scale the $0.0000338 resistance
The daily RSI for BONK was at 44 and below the neutral 50, underlining bearish momentum. The OBV also made a series of lower highs and lower lows over the past month. Together, with steady losses since mid-November, it highlighted that the bears still had the upper hand across the market.
The recent drop forced the memecoin to retest the 78.6% Fibonacci retracement level at $0.0000264, but it did not close a daily session below it. Since hitting the local lows at $0.0000248 on Friday, the altcoin’s price has shot up by 39%.
The $0.00004 zone had been a support, then flipped to resistance in recent weeks. It is expected that it will serve as a stern resistance once again. A daily session close above $0.0000394 would flip the daily market structure bullishly.
Liquidation levels agree with technical findings
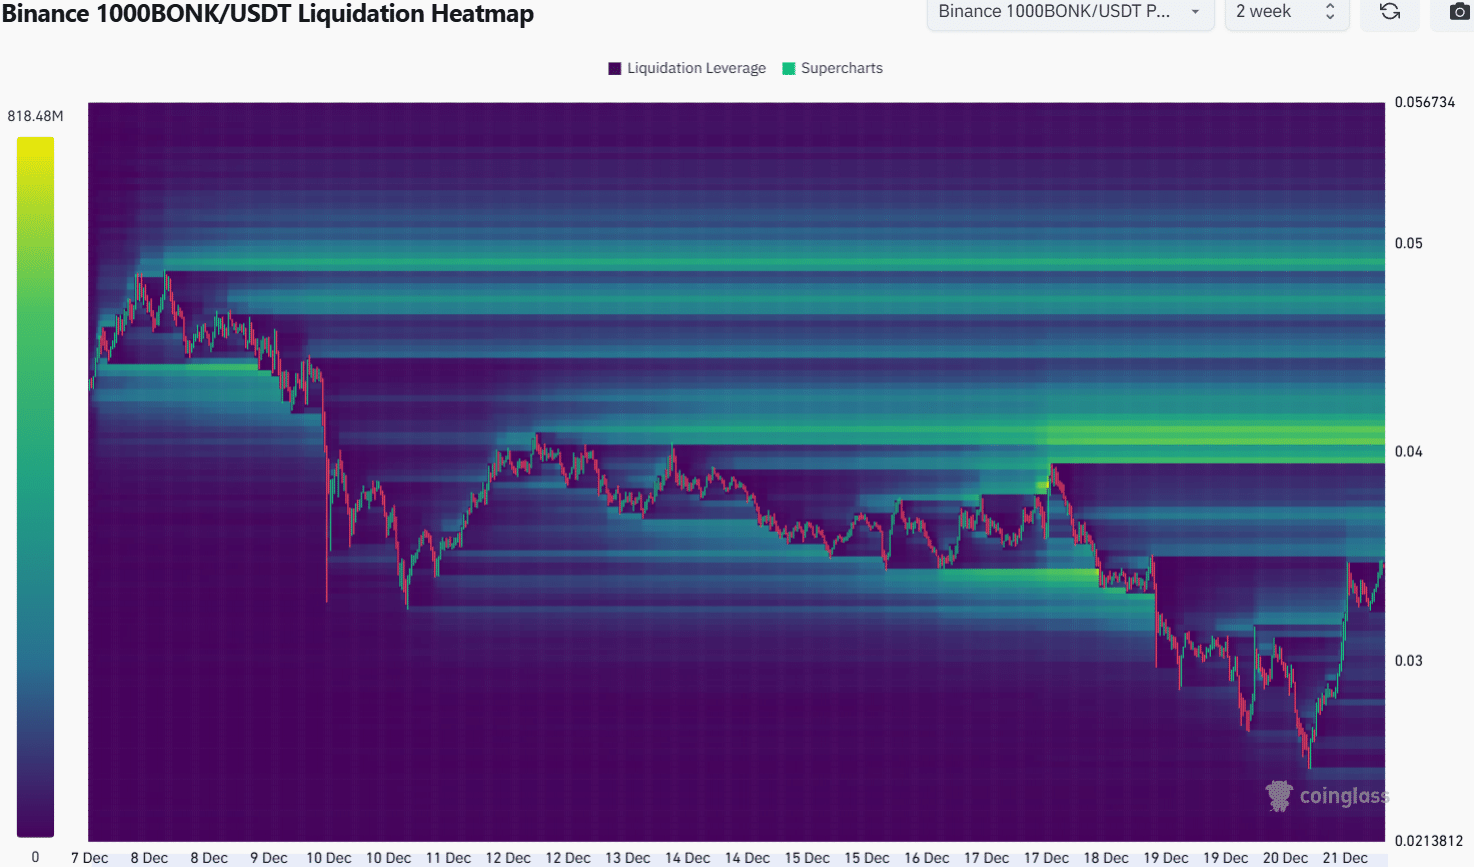
Source: Coinglass
The $0.00004 resistance zone identified on the daily chart had a sizeable concentration of liquidation levels around it, the 2-week lookback period liquidation heatmap showed.
AMBCrypto found that the liquidity to the south was relatively sparse as well. Therefore, a move to retest this resistance is highly likely in the coming days.
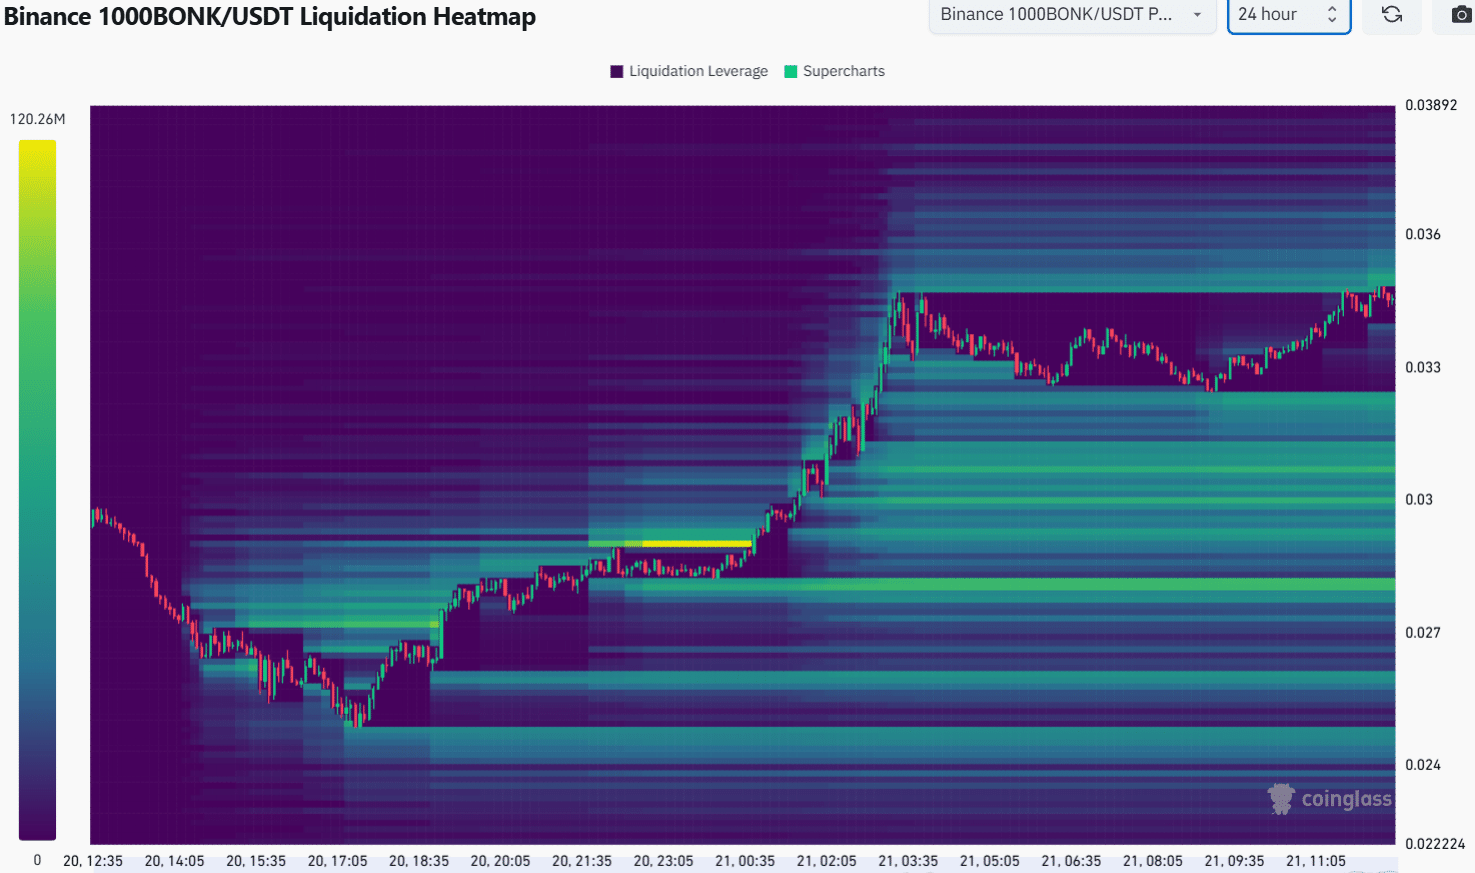
Source: Coinglass
The 24-hour liquidation heatmap pointed to a potential range formation between $0.0000322 and $0.000035. Hence, it is possible that the liquidity built up around $0.000035 in recent days could see a short-term bearish reversal.
Is your portfolio green? Check the Bonk Profit Calculator
And yet, the magnetic zone around $0.00004 seemed much stronger. Even in the event of a price dip over the next day or two, the target for the next week would be the $0.00004 resistance.
Disclaimer: The information presented does not constitute financial, investment, trading, or other types of advice and is solely the writer’s opinion


![Uniswap [UNI] price prediction - Traders, expect THIS after altcoin's 14% hike!](https://ambcrypto.com/wp-content/uploads/2024/12/UNI-1-400x240.webp)

