Bonk coin price prediction: Bullish in the short-term, key resistance 22% away

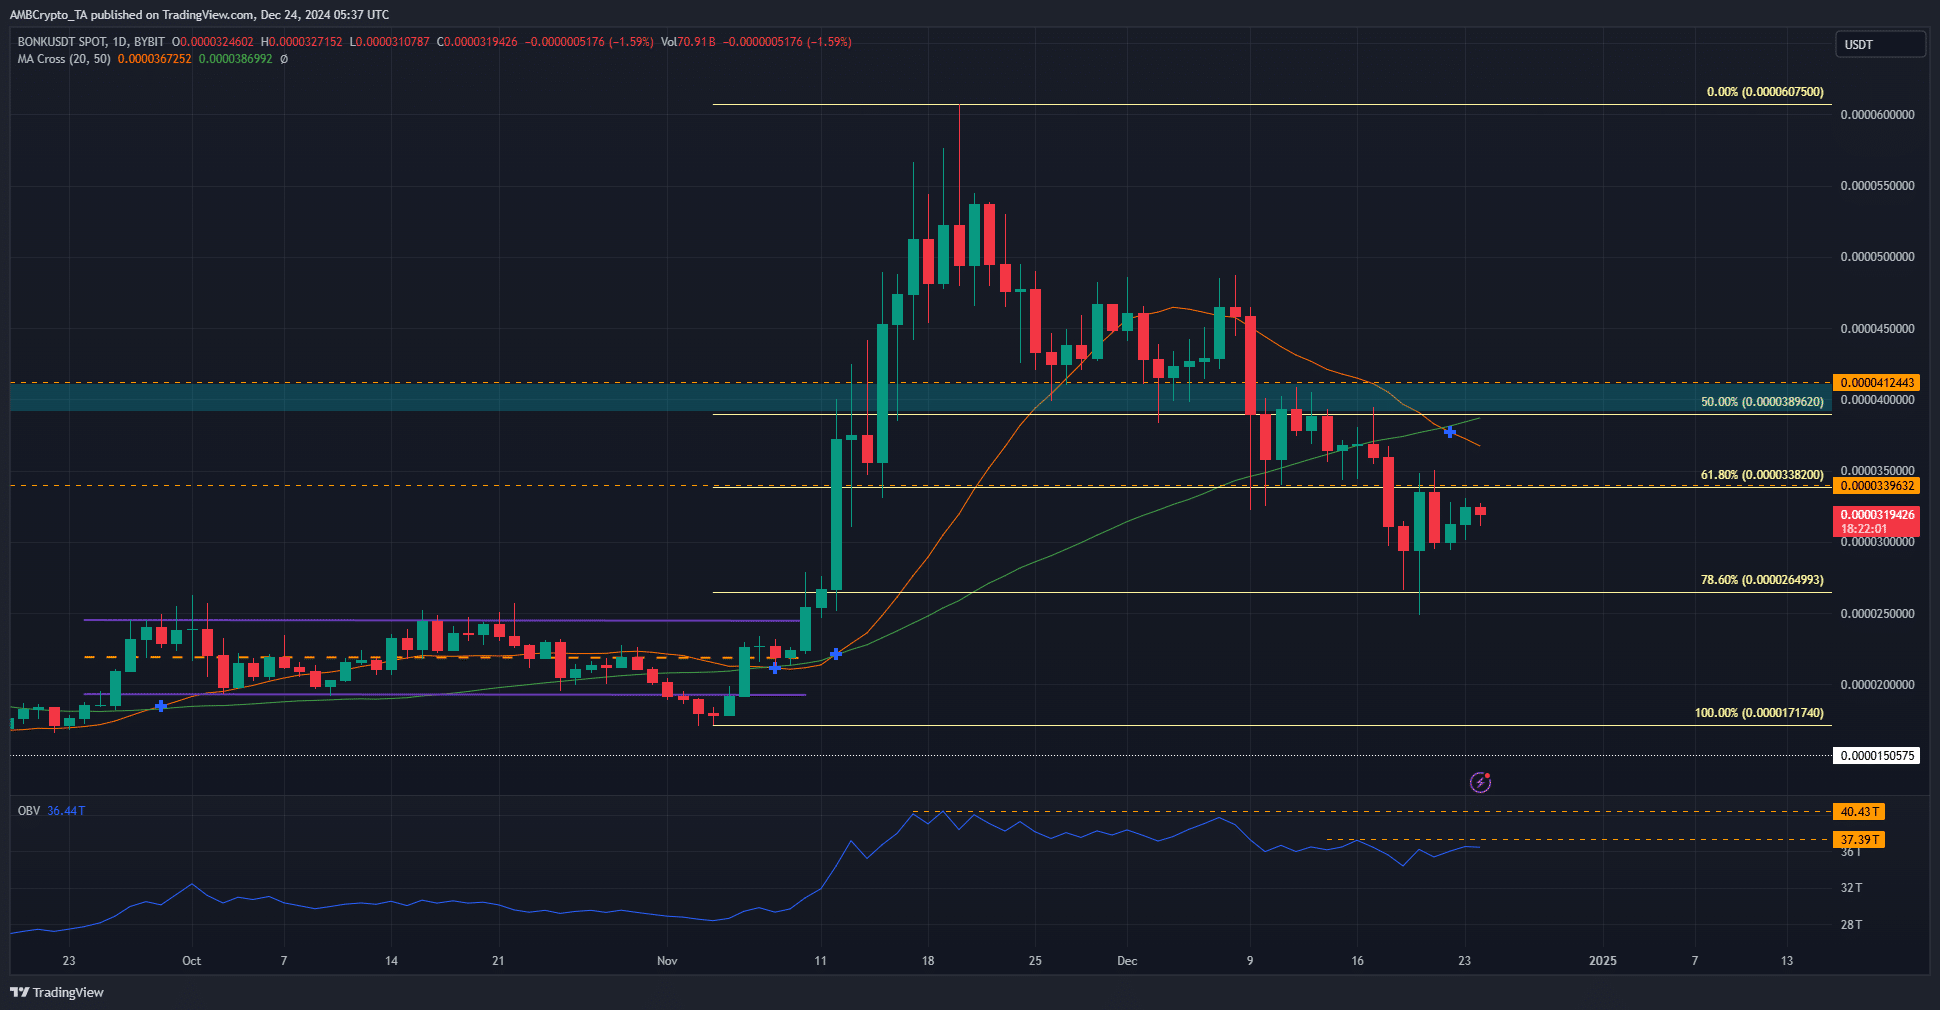
- BONK has a bearish structure and firm downward momentum.
- The lower highs for the OBV showed heightened selling pressure and needs to be reversed before recovery can begin.
Bonk [BONK] was trending downward in recent weeks and the retracement phase has not ended yet. The meme coin market as a whole has also shed gains over the past month and was yet to recover.
Technical analysis showed that there is hope for a price bounce in the short-term. However, it would be a retest of the resistance zone established earlier this month.
Moving averages form a bearish crossover
The 20 and 50-period moving averages were above the price and formed a bearish crossover recently to show that a downtrend was in progress. The drop below $0.00004 in the second week of December also pointed to the same idea- a deep retracement was ahead.
After the 78.6% Fibonacci retracement level at $0.0000264 was retested and defended as support, BONK bulls have some reason to cheer. Yet, there is work to be done.
The OBV has been forming lower highs since mid-November. This must be broken for the meme coin to regain its uptrend. Another thing to break was the bearish market structure, and a move past $0.000035 and a higher low thereafter would be the first step.
Bullish Bonk coin price prediction?
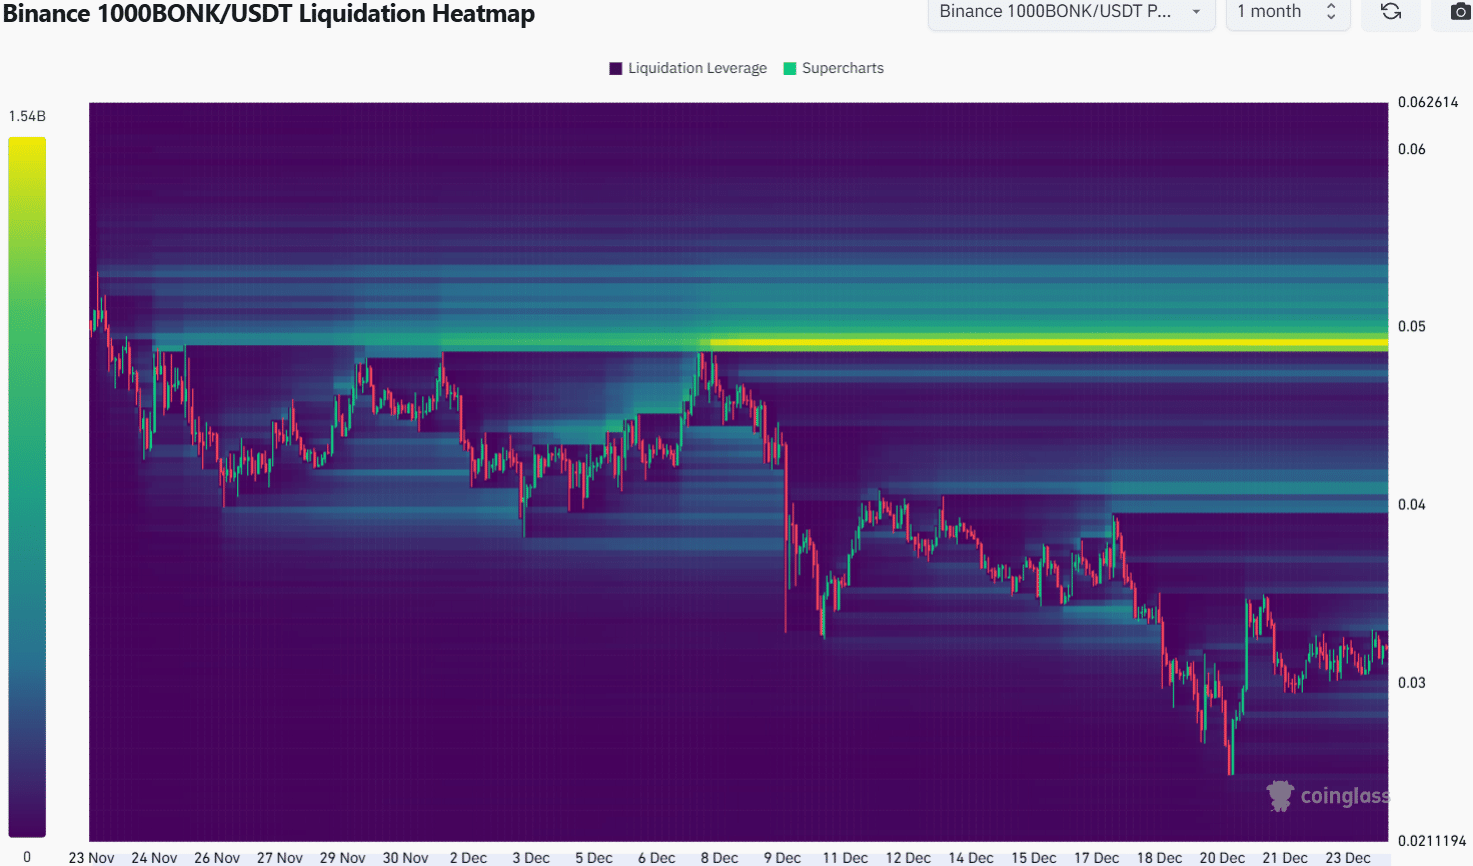
Source: Coinglass
The 1-month lookback period liquidation chart showed a cluster of liquidity at $0.000049. The magnitude of this liquidity pool meant that it was a likely target for BONK in the coming weeks.
Before that, the $0.00004 region could also see a minor move downward after a retest.
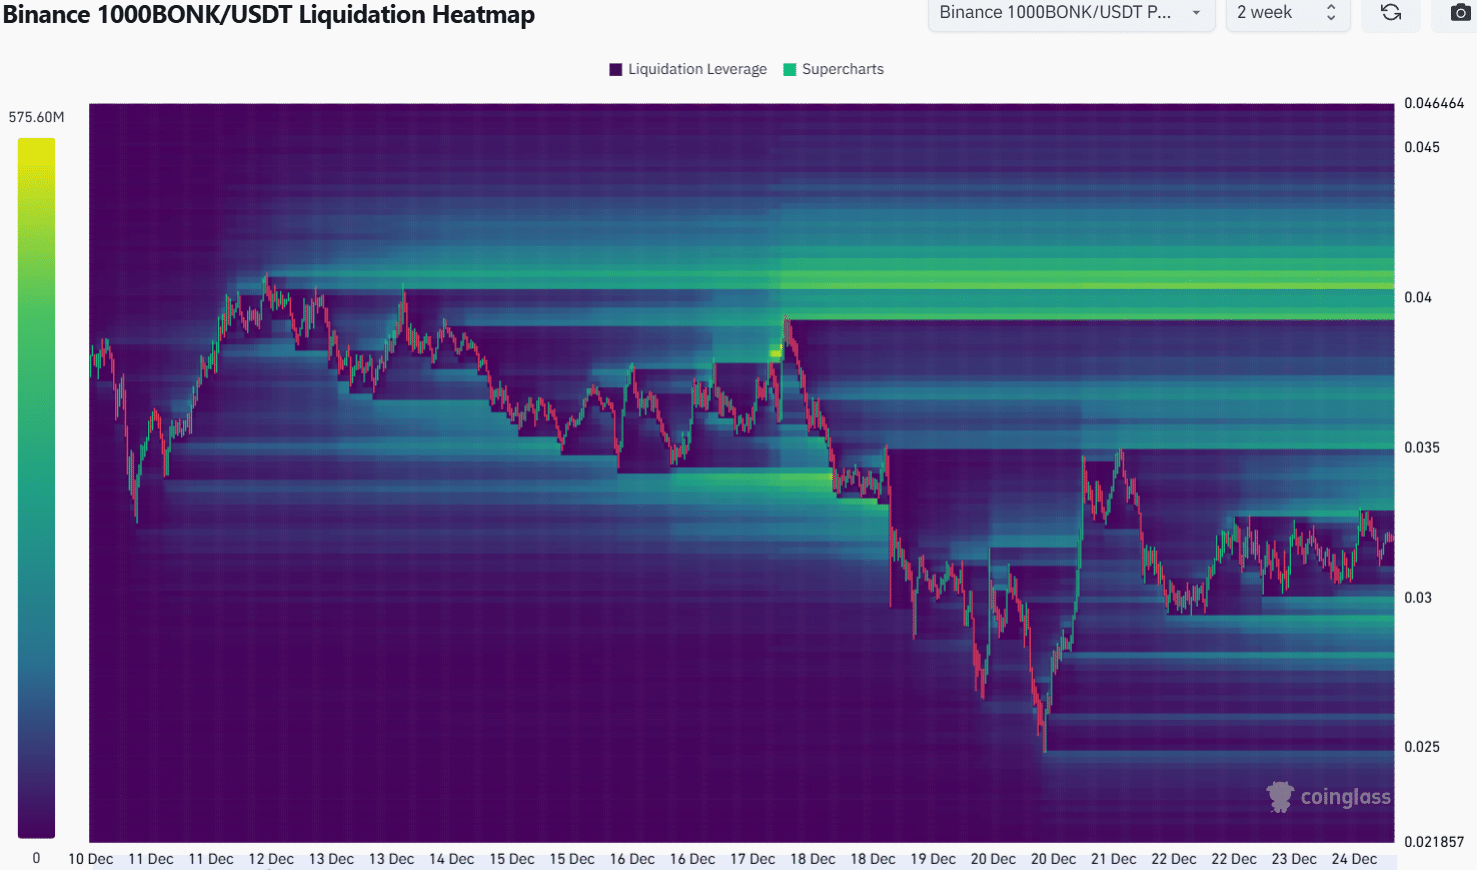
Source: Coinglass
The 2-week liquidation heatmap highlighted the resistance $0.00004 could pose. The liquidation levels here were likely to be swept before a retracement.
The depth of this retracement is unclear and would depend of the strength of BONK bulls and the bullish momentum Bitcoin has at that time.
Read Bonk’s [BONK] Price Prediction 2024-25
Below $0.00004, which was also a significant technical resistance zone, $0.000035-$0.000037 could also oppose the bulls.
Apart from day traders, the rest should be wary of BONK’s bullish chances until the $0.00004 resistance is flipped to support.
Disclaimer: The information presented does not constitute financial, investment, trading, or other types of advice and is solely the writer’s opinion

