Shiba Inu whale exodus – 70% outflows spark bearish fears so, what’s next for SHIB?
SHIB whales have been exerting significant selling pressure on the memecoin.

- Shiba Inu saw a massive fall in large holder netflows, hinting at a hike in selling pressure
- SHIB seemed to be trading in a descending triangle in the backdrop of its long-term downtrend
Shiba Inu’s (SHIB) large holders lost momentum with a 70% fall in their inputs, indicating wholesale wallet abandonment. The massive fall corresponded with Large Holder Netflows falling during a week when $1-$10 million SHIB wallet investors reduced their holdings by 31% in a day.
Whale cash-outs from the market lowered SHIB’s liquidity to levels where the price was stuck in bearish range below $0.000014. The lack of new whale activity would render it harder for SHIB to recover because it would break important support levels.
Market stability can only be possible if new investors enter the market based on minor hikes in trading volumes. The next phase is full of unknown possibilities because investors have a divided opinion regarding the condition of the market.
What does the weekly price action say?
SHIB’s price action, at press time, seemed to be trading within a descending triangle pattern. It rallied against the long-term downtrend resistance, but was supported by a critical horizontal support level. The press time price had climbed to the 0.000012688-level, one where strong demand had been seen before.
If the support holds, the price may rebound to test both ends of the descending trendline and possible upside targets between 0.000030000 to 0.000045000. The bearish structure would end when weekly price action shifts over descending resistance since it would signal positive momentum trends.
SHIB moving below 0.000010000 would indicate additional bearishness. This would reveal $0.000007000 to $0.000005000 as upcoming important support levels.
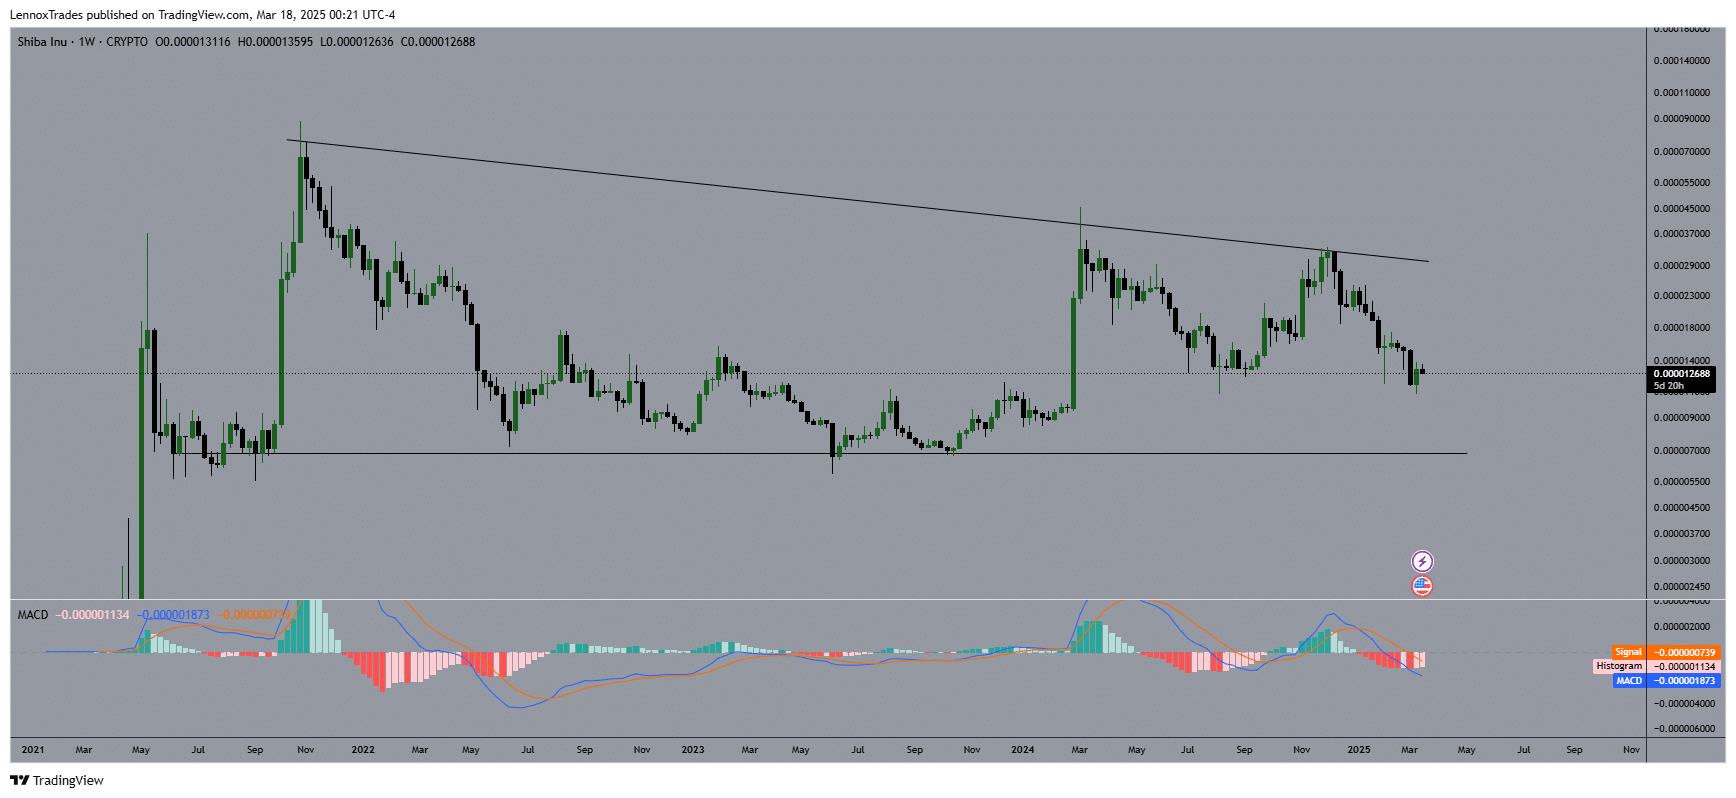
The MACD trend further revealed bearish conditions because the Signal line was below zero as histogram momentum continued to fall – A sign of declining bullish force. An upward price shift would be supported by the occurrence of a bullish cross pattern in the MACD.
When buyers enter the market, they will attempt to generate upward momentum. However, prolonged staying above $0.000012500 may not be possible and such conditions could result in either more time spent at current levels or a price drop.
SHIB’s active addresses and burn rate
On top of reducing whale activity, the number of SHIB active addresses decreased by 6.86% as new address creation fell by 6.94% and zero-balance addresses declined by 11.18%.
Additionally, active address numbers saw a 15.6k peak in February, before the numbers started depreciating again.
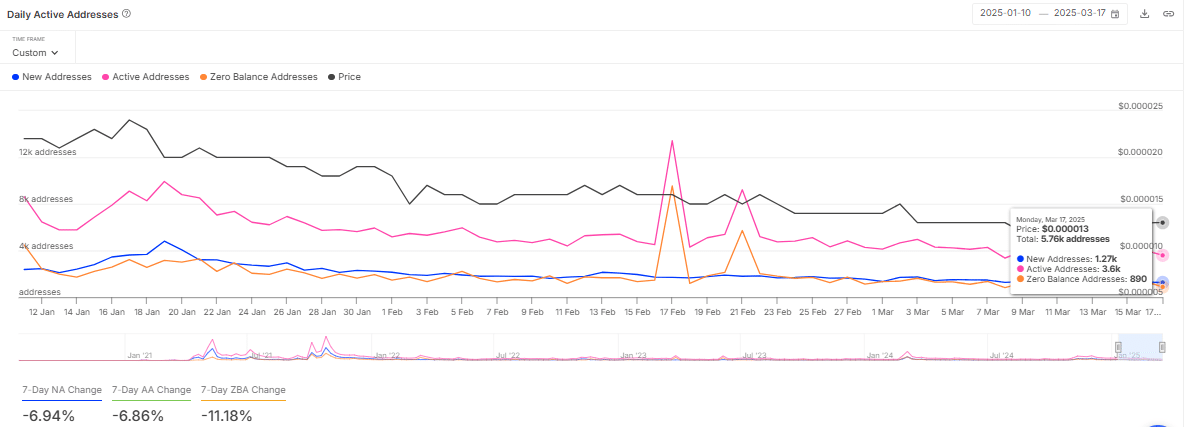
The network activity reached its peak at 1.4M addresses. Alas, it then declined when it hit its minimum of 1.38M addresses towards the end of mid-February.
Worth pointing out, however, that the 49,552% surge in the daily burn rate did not result in significant changes. This is yet more evidence that some of the on-chain metrics are not always directly related to price performances.